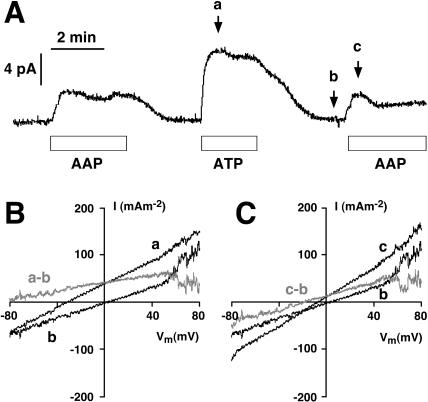
FIGURE 1.
The basic experiment: ATP activates an outward current (cytoplasm to vacuole) through the short-circuited vacuolar membrane of yeast. (A) Current trace from a yeast vacuole recorded in the whole-vacuole configuration with the membrane voltage-clamped to 0 mV. Symmetrical ionic conditions with pHC = 7.5 and pHV = 5. The bars below the traces indicate perfusion of the recording chamber with 5 mM ATP + 5 mM ADP + 10 mM Pi (AAP), or with 5 mM ATP (ATP), respectively. Voltage ramps of 5 s duration were applied at the arrows marked a, b, and c, and the corresponding I-V curves are shown in B and C. (B) I-V curves taken from the vacuole in A, at times indicated by the arrows. Curve a describes the tonoplast I-V characteristics in the presence of 5 mM ATP, and curve b, that of the nonenergized membrane. The difference curve (a–b) characterizes the V-ATPase. With only ATP present at the cytosolic side, the pump curve never intersected the voltage axis; the apparent increase of pump current at positive voltages was due to ion channel activity in the control (curve b). (C) I-V curves from the vacuole in A, describing the membrane energized by 5 mM ATP + 5 mM ADP + 10 mM Pi (curve c), compared with the control (curve b). The pump I-V curve (c–b) clearly intersects the voltage axis at ∼−20 mV, indicating that the pump runs in the reverse direction when the driving force (membrane voltage) is sufficiently large (negative to −20 mV). As in B, the dip at the positive end of the difference I-V trace is due to channel activity in the control curve.

