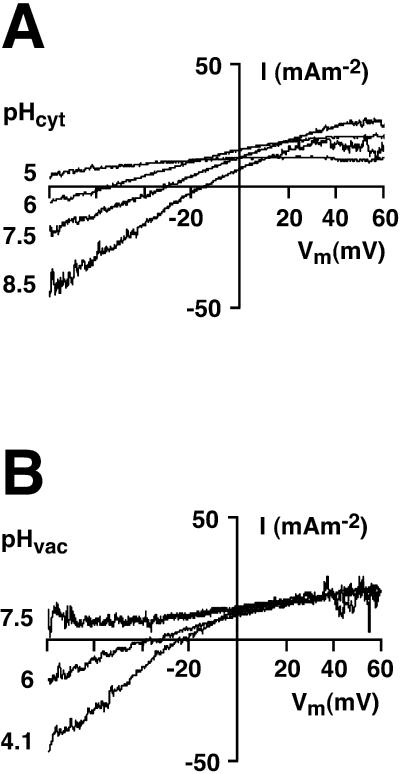
FIGURE 3.
The reversal voltage for the yeast V-ATPase shifts positive with alkalinization of the cytoplasm (A), and negative with alkalinization of the vacuole (B). Averaged difference I-V curves are shown for at least three recordings under each condition; pumping was activated in each case by AAP medium, and the I-V curves were generated as in Fig. 1, B and C, and Fig. 2 B. (A) Vacuolar pH set at 5.0; cytosolic pH varied as indicated from 5 to 8.5. With symmetrical pH (pHV = pHC = 5), there is no intersection of the I-V curve with the voltage axis within the applied voltage range of −80 mV to +60 mV. With a pH difference of 1 unit, the reversal voltage (ER, the intersection of the difference I-V curve with the voltage axis) was roughly −60 mV; and it shifted to more positive voltages as the pH gradient increased. Pump currents saturated at positive membrane voltages. (B) Cytosolic pH set at 7.5; vacuolar pH varied as indicated from 7.5 to 4.1. As in A, the pump I-V curve failed to intersect the voltage axis under symmetrical pH conditions (pHV = pHC = 7.5). At a ΔpH of 1.5 the reversal voltage was ∼−40 mV and shifted again toward positive voltages with the pH difference increased.

