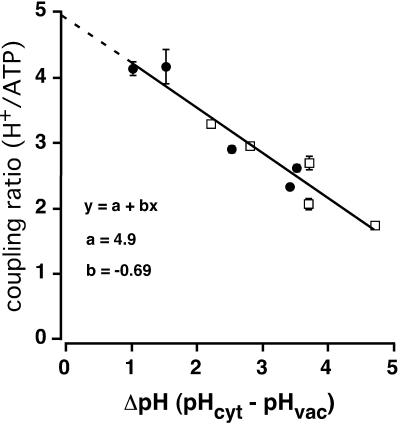
FIGURE 4.
For yeast (•) and plant (□) V-ATPases, the coupling ratio declines linearly with increasing ΔpH. Solid circles denote coupling ratios calculated from Fig. 3, above, as described by Eq. 3. Unfilled squares are taken from Davies et al. (1994), for coupling ratios of red beet vacuoles. Error bars of solid circles denote the min and max values of n as shown in Table 2, column 8, and error bars of unfilled squares the min and max values of n as given by Davies et. al. (1994). The solid curve was fitted by least squares to the equation y = a + bx, with y being the coupling ratio and x being ΔpH (a = 4.9; b = −0.69).

