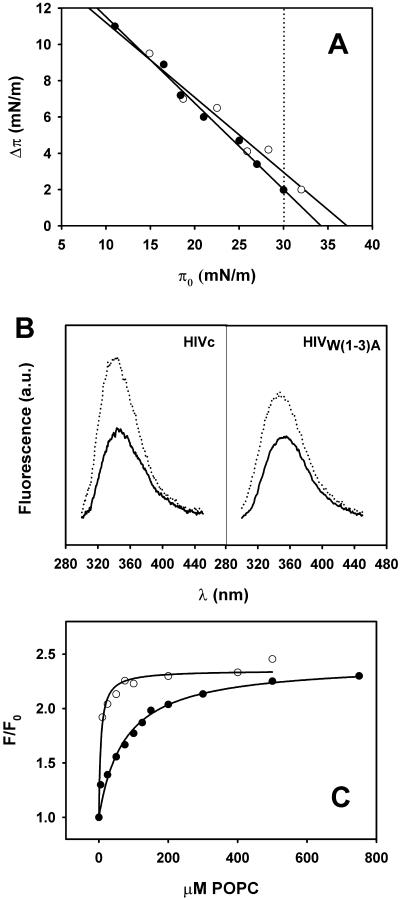
FIGURE 6.
Interaction of HIVc (open circles) and HIVW(1–3)A (filled circles) with membranes. (A) Penetration of the peptides into POPC monolayers. The maximal increase in surface pressure produced upon injection of peptide in the subphase has been plotted as a function of the initial pressure of the phospholipid monolayer. The dotted line begins at 30 mN/m. (B) Fluorescence emission spectra in buffer (continuous lines) and incubated with POPC LUV (dotted lines). Peptide concentration was 0.5 μM and, in vesicle samples, the peptide/lipid ratio was 1:200. (C) Partitioning into membranes. Curves were estimated from the fractional change in Trp fluorescence in the presence of increasing amounts of POPC LUV. The solid lines correspond to the best fits of the experimental values to Eq. 2.

