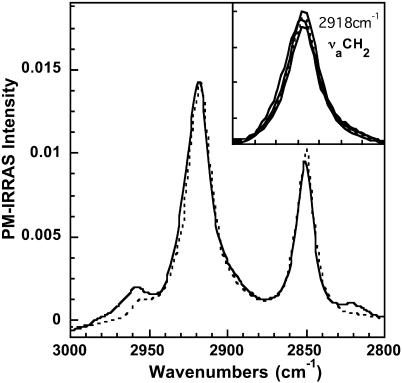
FIGURE 5.
Experimental (solid line) and calculated (dotted line) PM-IRRAS spectrum of a polymerized OTMS monolayer 90 min after injection of DMPC vesicles into the subphase. Calculation has been performed with an OTMS monolayer thickness of 22 Å and a DMPC thickness of 39 Å. (Inset) Calculation with a DMPC thickness of 34 and 44 Å are shown together with the experimental and calculated spectra of the main figure, in the antisymmetric νaCH2 stretching band domain.

