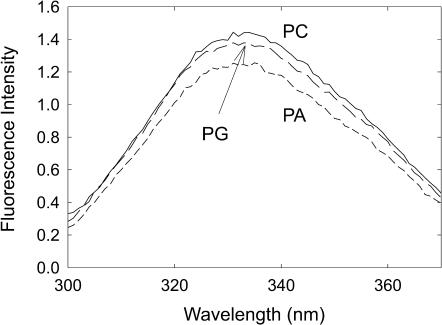
FIGURE 2.
Fluorescence emission spectra for KcsA. Spectra are shown for KcsA reconstituted into bilayers of DOPC (solid line), DOPG (long dash), and DOPA (short dash). Wavelengths of maximum emission are listed in Table 1. The concentration of KcsA was 0.24 μM and the molar ratio of lipid to KcsA was 100:1. The buffer was 20 mM HEPES and 1 mM EGTA at pH 7.2.

