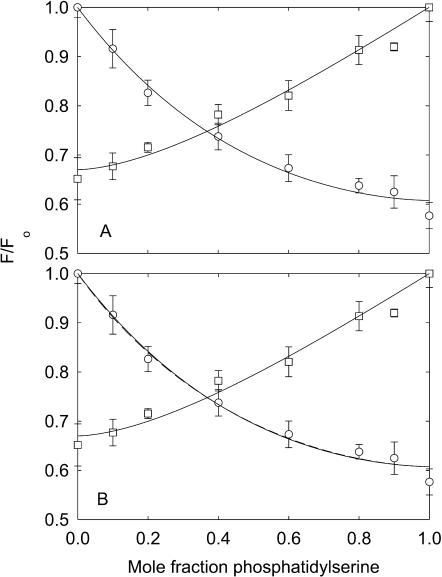
FIGURE 6.
Quenching of KcsA fluorescence in mixtures with phosphatidylserine at high ionic strength. The buffer was 20 mM HEPES, 1 mM EGTA at pH 7.2, and 500 mM KCl. KcsA was reconstituted into bilayers containing mixtures of BrPC and DOPS (□), and BrPS and DOPC (○). Fluorescence intensities are expressed as F/Fo where Fo is the fluorescence intensity in the nonbrominated lipid. In A, the solid lines show fits to Eq. 2 giving the values for relative binding constants listed in Table 2. In B, the solid line for the BrPC/DOPS experiment shows a fit to Eq. 2 giving the annular binding constant and the lines for the BrPS/DOPC experiments show fits to the annular/non-annular binding site model, assuming (solid line) that all the fluorescence can be quenched from the non-annular sites (Eq. 5) and (broken line) that only 60% of the fluorescence can be quenched from the non-annular sites (Eq. 6). Values for the binding constants are listed in Table 3.

