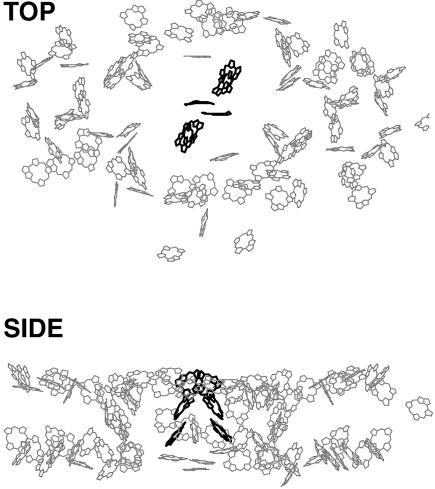
FIGURE 1.
Top (upper) and side (lower) view of the spatial arrangement of chla molecules in the PSI core of Synechococcus elongatus, as derived from the 2.5 Å structural model. The gray molecules represent the antenna chls whereas the black molecules represent the chls in the RC. For clarity the phytol tails of the molecules have been omitted.

