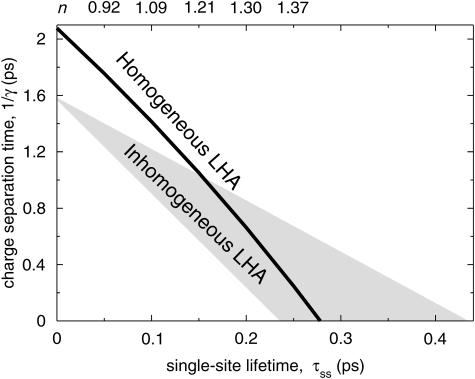
FIGURE 2.
(Solid line) Combinations of the charge-separation time 1/γ and the average single-site lifetime τss that result in a longest lifetime of 18 ps in PSI modeled with a homogeneous antenna. The upper axis shows the values of the index of refraction, n, that correspond to the values of τss on the lower axis (only for homogeneous antenna). The gray area encloses the interval in which similar relationships between 1/γ and τss occurred for 16 random representations of a heterogeneous antenna (see text for details).

