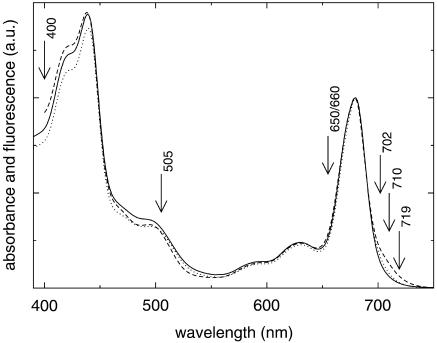
FIGURE 1.
Room-temperature absorption spectra of monomeric (solid) and trimeric (dotted) PSI from Synechocystis PCC6803 and trimeric PSI from Synechococcus elongatus (dashed). Note the clear differences in red chl content. Arrows indicate the wavelengths of excitation that were used in the experiments. The spectra were normalized to the maximum in the Qy region.

