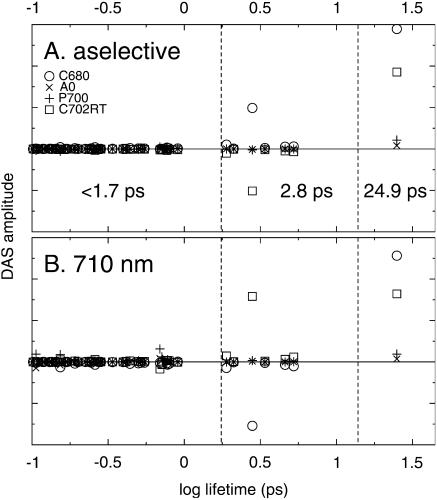
FIGURE 7.
Contributions of the different spectral pools to the decay-associated spectra of all 96 lifetimes occurring in the simulation of (trimeric) Synechocystis PCC6803, for excitation at 400 nm (A) and 710 nm (B). Pools: C680 (circles), C702RT (squares), P700 (plusses), and A0 (crosses). Note that only three distinct dominant lifetimes occur, i.e., 24.9 ps, 2.8 ps, and <1.7 ps. The dashed vertical lines mark the lifetime intervals over which the DAS were summed to obtain the DAS in Fig. 8. For details see text.

