Abstract
For insight into the solvent structure around protein molecules and its role in phase transformations, we investigate the thermodynamics of crystallization of the rhombohedral form of porcine insulin crystals. We determine the temperature dependence of the solubility at varying concentration of the co-solvent acetone, Cac = 0%, 5%, 10%, 15%, and 20%, and find that, as a rule, the solubility of insulin increases as temperature increases. The enthalpy of crystallization,  , undergoes a stepwise shift from ∼−20 kJ mol−1 at Cac = 0%, 5%, and 10% to ∼−55 kJ mol−1 at Cac = 15% and 20%. The entropy change upon crystallization
  is ∼35 J mol−1 K−1 for the first three acetone concentrations, and drops to ∼−110 J mol−1 K−1 at Cac = 15% and 20%.
  indicates release of solvent, mostly water, molecules structured around the hydrophobic patches on the insulin molecules' surface in the solution. As Cac increases to 15% and above, unstructured acetone molecules apparently displace the waters and their contribution to
  is minimal. This shifts
  to a negative value close to the value expected for tying up of one insulin molecule from the solution. The accompanying increase in
  suggests that the water structured around the hydrophobic surface moieties has a minimal enthalpy effect, likely due to the small size of these moieties. These findings provide values of the parameters needed to better control insulin crystallization, elucidate the role of organic additives in the crystallization of proteins, and help us to understand the thermodynamics of the hydrophobicity of protein molecules and other large molecules.
INTRODUCTION
Type 1 diabetes is a condition that affects about one million Americans, and 0.3% of the world's population. It occurs when the pancreas produces little or no insulin, a hormone essential for glucose metabolism. Insulin deficiency leads to dangerously high blood sugar levels. Type 1 diabetes usually affects young people, who are then dependent on an artificial source of insulin for life (Brange, 1987).
Insulin is often administered through daily injections, which can become an inconvenience to the patient, and can be dangerous if administered incorrectly. The frequency of these injections can be reduced considerably by the use of suspensions of crystallites (Schlichtkrull, 1965; Schlichtkrull et al., 1972). Sustained release of the insulin into the blood stream is achieved if the crystallites have a narrow size distribution (Long et al., 1996; Peseta et al., 1989; Reichert et al., 1995). Currently, insulin crystals are being filtered through a sequence of sieve trays to ensure such narrow size distribution (Brange, 1987). Optimization of the crystallization procedures to yield crystals of narrow size distribution could allow complete elimination of the filtering stage. Data on the thermodynamics of insulin crystallization is a necessary fundamental step in the study of this system (Brange, 1987).
The primary goal of the investigations reported here was to characterize the thermodynamics of crystallization of insulin. For this, we determine the solubility of insulin at varying solution composition and temperature. Analyzing the thermodynamics data, we conclude that the hydrophobic attraction is a major factor for the crystallization of insulin. The hydrophobic force was defined in the 1960s as the interaction between nonpolar molecules or surface patches that only exists when the nonpolar moieties are submerged in water (Eisenberg and Kauzmann, 1969; Tanford, 1961). The free energy of a pair of molecules is lowered when the molecules are closer because of favorable entropic and enthalpic contributions (Chandler, 2002). The entropy increase stems the destruction of the rigid shell of ordered water molecules built around nonpolar surfaces in an attempt to preserve four hydrogen bonds per each water molecule (Tanford, 1980). With relatively small nonpolar molecules this entropy effect accounts for the complete thermodynamics of hydrophobicity (Tanford, 1980). It has recently been pointed out that around larger nonpolar molecules the number of hydrogen bonds per water molecules cannot be preserved (Chandler, 2002). As a result, when two nonpolar surfaces are brought together, the release of the waters structured around them not only leads to an entropy increase, but also to an enthalpy loss due to the restoration of four hydrogen bonds around each of the waters involved (Chandler, 2002).
Due to this relation between the thermodynamics of intermolecular interactions and the structuring of the water molecules around the certain patches of the protein molecular surface, we use thermodynamics data to elucidate the interactions and structuring of the solvent around the protein molecules (Petsev and Vekilov, 2000; Vekilov et al., 2002b). Because many proteins are crystallized from solutions containing organic additives (Farnum and Zukoski, 1999; Galkin and Vekilov, 2000; Kulkarni et al., 1999; Sauter et al., 1999), the effects of these additives on the protein's interaction are of interest and are addressed here on the example of acetone, a co-solvent sometimes used in insulin crystallization (Harding et al., 1966).
METHODS
Solutions
The protein material used in the experiments was porcine insulin from Sigma. To prepare stock solutions, the protein was dissolved in 0.02 M HCl at a ratio of ∼15 mg insulin per 1 ml HCl and then filtered using Millipore Ultrafree-CL microcentrifuge filters with molecular weight cutoff of 30 kDa to remove solid residue. The concentration of the solution was determined at various dilutions at 280 nm in a spectrophotometer using an extinction coefficient of 1.04 ml mg−1 cm−1 (Pace et al., 1995). The blank used to calibrate the spectrophotometer was pure 0.02 M HCl. These solutions were stored at 4°C and disposed of after ∼3 weeks.
To an aliquot of insulin solution in 0.02 M HCl were added, in the order listed, 0.10 M zinc chloride (Sigma, St. Louis, MO), 0.2 M trisodium citrate (Fisher, Fairlawn, NJ), and neat acetone (SPLC-grade, Fisher). Thus, the final concentrations of the components in the crystallizing solutions were: insulin, between 0.75 and 5 mg ml−1; ZnCl2, 0.005 M; trisodium citrate, 0.05 M; and acetone, between 0 and 20%, in 0.02 M HCl (Peterson, 1959; Schlichtkrull, 1956, 1957; Smith, 1995).
Solvent samples without insulin were prepared in the same way as the crystallizing solutions substituting 0.02 M HCl in place of the insulin stock solution. Approximately 15 ml were prepared in advance. These solutions were quickly sealed to prevent evaporation of volatile species, labeled, and stored in the refrigerator.
Determination of the protein concentration
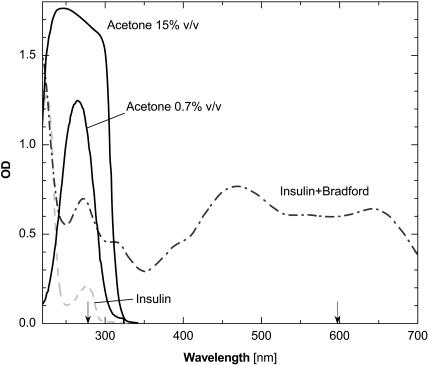
We implemented a procedure for determination of the protein concentration in solutions containing acetone. Typically, the protein concentration is evaluated from the optical density at a wavelength of 280 nm using Beer's law (Harris, 2001). This method is not applicable in solutions containing acetone because acetone absorbs light at this wavelength, Fig. 1. To circumvent this difficulty, we employed the Bradford reagent (Bradford, 1976; Reichert et al., 1995), whose complex with insulin has significant optical density at a higher wavelength at which acetone has no absorbance, see Fig. 1.
FIGURE 1.
Spectrophotometry scans of insulin and acetone solutions in the HCL/ZnCl2/citrate mixture used in the crystallization experiments and a spectrum of insulin in the presence of the Bradford reagent. Calibration with deionized water. The wavelengths 280 and 595 nm are marked with arrows.
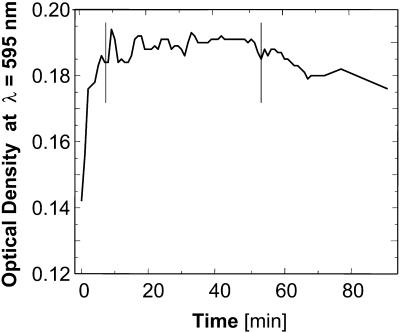
Calibration curves were established for each acetone concentration. For each calibration curve, we prepared six solutions with concentrations of insulin in the approximate range 0.2 – 1.2 mg ml−1. A 50-μl solution sample was added to 500 μl of Bradford Reagent (Bradford, 1976; Reichert et al., 1995), mixed, sealed, and allowed to sit for 20 min. Tests, illustrated in Fig. 2, revealed that 20 min was the optimal delay for stable optical density readings. The samples were then placed in clean cuvettes and loaded into the spectrophotometer, calibrated with 500 μl Bradford Reagent + 50 μl 0.02 M HCl. Absorbance readings were taken at 595 nm; two readings for each insulin concentration were averaged.
FIGURE 2.
Changes of the optical density at λ = 595 nm with time in insulin solutions containing Bradford Reagent added at t = 0 min. Vertical bars mark time interval of steady optical density between ∼8 and 50 min. Insulin solution used contains 500 μl Bradford Reagent and 50 μl 15% acetone.
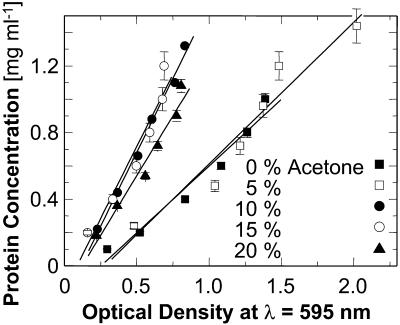
The calibration curves, i.e., the dependencies of the optical density with the Bradford Reagent on the protein concentration of the samples, are shown in Fig. 3. These linear relationships were then used to relate protein concentration to optical density at 595 nm. Two additional solutions with 0% acetone and two with 15% acetone were used to check the accuracy of the respective calibrations.
FIGURE 3.
The concentration calibration curves using Bradford Reagent for all acetone concentrations used in this work. Error bars correspond to the standard deviation of several determinations.
In the course of solubility determinations, protein concentrations of solution samples were determined by adding 500 μl Bradford Reagent to 50 μl of the tested solution. The samples were covered, mixed, allowed to sit for 20 min, and their optical density was read. The protein concentration was determined from the calibration curves discussed above.
Determination of the temperature dependence of the solubility
The solubility of insulin crystal solutions was determined using a batch technique (Fischel-Ghodsian, 1988). For each acetone concentration, 18 vials were carefully labeled, filled with 700 μl solvent solution, and separated into six groups, kept at 4°C, 10°C, 15°C, 20°C, 25°C, and 30°C, respectively. A refrigerator was used to maintain 4°C, water circulators for 10°C, 15°C, and 20°C, and two incubators were kept at 25°C and 30°C, respectively. The vials in the water circulators were tightly sealed and floated on the water surface by attaching pieces of Styrofoam to their tops in a way that ensured that the entire solution volume was submerged.
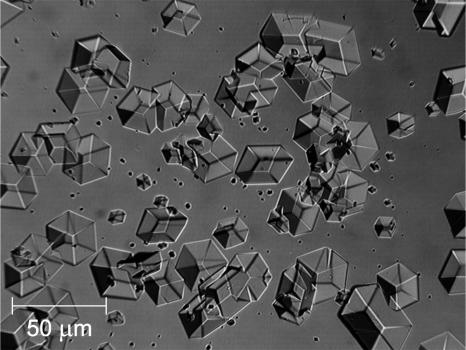
Independently, a suspension of crystals in solution was prepared by keeping a 200-μl crystallizing solution at 4°C. Each day, after gentle stirring to ensure that the crystals are suspended in the solution volume, an aliquot containing crystals was taken and released into the vials kept at the different temperatures. On the next day, a small sample was taken from the bottom of the vials and observed under a microscope. A typical picture of the rhombohedral crystals seen with this procedure is shown in Fig. 4. If no crystals were detected, it was assumed that all of the crystals had dissolved and more were added. In some cases, after extended lengths of time, if at T > 25°C or at Cac ≥ 10% the microscopic observations revealed the presence of a noncrystalline precipitate, these solutions were discarded. In the vials, in which undissolved crystals were found, the protein concentration of the supernatant was determined using the procedures discussed above. For this, after ∼30 min of rest to ensure sedimentation of the crystallites, 50 μl samples was taken from the top of the vials.
FIGURE 4.
Rhombohedral insulin crystals used in the solubility determinations.
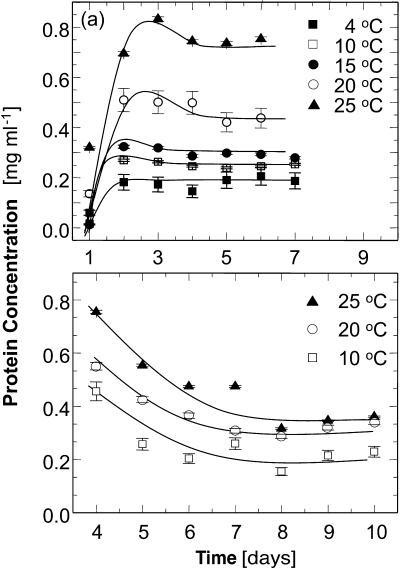
This procedure was followed for each sample until the concentrations were steady for three consecutive days. Examples of the concentration evolutions in the supernatant in contact with crystallites are shown in Fig. 5. In most cases, the crystals added to a solution sample kept at a certain temperature dissolved over time until solubility was reached. This led to increasing concentration in the monitored supernatant until saturation was reached. In some cases, samples of the solutions at 4°C were taken before equilibration at that temperature. As a result, the solution concentration was significantly higher than the solubility. The addition of an aliquot of this solution to a solution kept at higher temperatures brought the concentration of the recipient solution to a value above the solubility at the respective T. The respective evolution curves in Fig. 5 b show a decrease of the concentration with time. Furthermore, since the presence of detectable crystals was used as a criterion to decide whether to add new crystals to a solution, sometimes crystals were added to already saturated solutions and this leads to nonmonotonic concentration evolution curves, such as those in Fig. 5 a.
FIGURE 5.
Representative time evolution curves of the protein concentration during solubility determinations. Lines are just guides for the eye. (a) Cac = 15%; equilibrium reached by dissolution of crystals; for discussion of local maximum at 3–4 days, see text. (b) Cac = 10%; equilibrium reached by the growth of initially added crystals; for discussion see text. Error bars correspond to the standard deviation of three determinations, as discussed in text.
Steady concentration values were taken as evidence of equilibrium between the crystals and solution. The equilibrium concentrations were determined as averages over three vials of identical composition and history and over at least three last steady readings for a total of at least nine data points. For most of the tested conditions the standard deviation determined from these data points ranged from 4% to 6%.
The equilibrium concentrations were plotted as a function of the temperature at which the solutions were kept (Feeling-Taylor et al., 1999; Galkin and Vekilov, 2000). This process was repeated for each acetone concentration. Two runs were performed for 15% acetone to verify the accuracy and reproducibility of this method.
RESULTS
Solubility
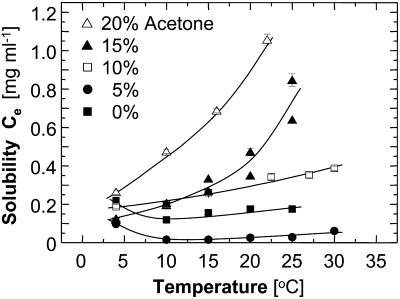
Fig. 6 shows that the solubility of insulin mostly has a normal dependence on temperature—as temperature increases, solubility increases. The presence of acetone in the solution affects the solubility as well as its sensitivity to temperature changes—higher acetone concentrations leads to higher solubility and to wider concentration variations in response to temperature. Whereas the solubility with no acetone is in the range of 0.1–0.2 mg ml−1, for 20% acetone it ranges between ∼0.25 and 1.1 mg ml−1.
FIGURE 6.
The temperature dependence of the solubility Ce of insulin crystals at five acetone concentrations. Lack of data points at higher acetone concentrations and temperatures is due to protein precipitation.
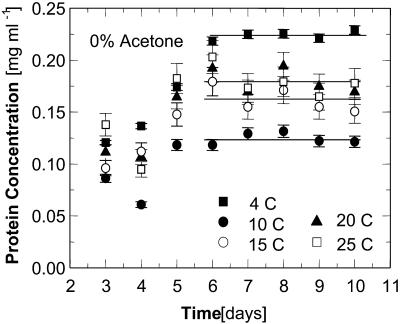
Solutions containing 0 and 5% acetone exhibit a higher solubility at 4°C than at the higher temperatures. For evidence that this higher solubility at 4°C at Cac = 0 is not the result of experimental error, we show in Fig. 7 the concentration evolution curves.
FIGURE 7.
Time evolution of protein concentration during a solubility determination at Cac = 0%. Error bars correspond to the standard deviation of three determinations.
The solubility curve for 5% acetone is so low that the error in each determination is commensurate with the respective solubility value. Thus, data at 5% acetone are not used to extract thermodynamic potentials.
Enthalpy and free energy
The standard enthalpy of crystallization (also called the latent heat)  can be evaluated from the solubility using the Gibbs-Helmholtz equation (Atkins 1998),
 |
(1) |
where Kcryst = exp( ) is the equilibrium constant for crystallization, T is absolute temperature,
  is the standard change of Gibbs free energy upon crystallization, and R = 8.314 J mol−1 K−1 is the universal gas constant.
The crystallization equilibrium constant Kcryst can be represented as (Atkins, 1998),
 |
(2) |
where ae is the activity of insulin in solution in equilibrium with the crystals, γe is the activity coefficient, Ce is the solubility, and Co = 1 mol kg−1 is the concentration of the solution in the typically chosen standard state. As discussed in Vekilov and Chernov (2002), the selection of a different standard state, e.g., 1 mmol kg−1, does not affect the values of  , whereas the shift in the determined values of
  and
and  are relatively minor and do not affect the conclusions about the underlying physical processes.
The activity coefficient at equilibrium between crystal and solution γe, was evaluated from the relationship (Hill, 1986; Yau et al., 2000),
 |
(3) |
Although data concerning the second virial coefficient B2 for insulin are not available, we note that for proteins under crystallizing conditions B2 is always negative and the maximum magnitude on record is |B2| = 8 × 10⁻⁴ cm3 mol g−2 (George and Wilson, 1994; Guo et al., 1999; Rosenbaum et al., 1996). Using this value of B2, for Ce < 1 mg ml−1 = 10−3 g cm−3, we get γe = 0.946, i.e., assuming γe ≈ 1 yields at most 6% bias in the values of Kcryst. Since in solutions containing Zn2+, insulin is present as a hexamer (Blundel et al., 1972), and the hexamers are the building blocks of the crystals (Yip et al., 1998; Yip and Ward, 1996), we use the relative molecular mass of the hexamer Minsulin = 34,800 g mol−1.
Combining Eqs. 1 and 2, with the approximation γe ≈ 1, we get
 |
(4) |
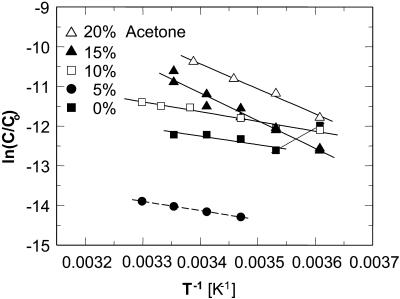
Thus,  can be evaluated from the slope of the straight lines lnCe(T−1) in Fig. 8, in which the Ce values were converted to mol kg−1 of solvent. Most of the resulting
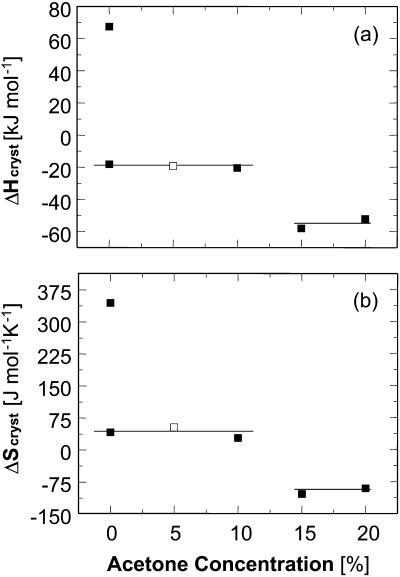
  values, plotted in Fig. 9 a are negative, as can be expected from the normal dependence of the solubility on temperature. The upper point at 0% acetone indicates high positive enthalpy and corresponds to the strong decrease in solubility between 4 and 10°C seen in Fig. 6 and Fig. 7.
FIGURE 8.
The temperature dependence of the solubility Ce in the coordinates of the Gibbs-Helmholtz equation ln(C/Co) vs. T−1. Solid lines are linear fits to data at Cac = 0, 10, 15, and 20%, with slope =  The dependence at Cac = 0% changes slope, allowing two determinations of
  . Dashed line is a simulated line through data at Cac = 5%, calculated as discussed in the text.
FIGURE 9.
Variations with acetone concentration of (a) standard crystallization enthalpy  and (b) standard entropy change for crystallization
  . Pairs of points at Cac = 0 correspond to two straight lines in Fig. 8. Open symbols at Cac = 5% are results of
  interpolation as discussed in the text. The high values of H and S at Cac = 0% step from the low temperature solubility data at this Cac in Fig. 6.
Because of the large error inherent in the solubility determinations at Cac = 5%, the enthalpy value at this concentration was not evaluated from the data, but was interpolated from the  values at 0 and 10% acetone. The veracity of this interpolation was checked by simulating a lnCe(T–1) line with the chosen
  and Ce(20°C) = 0.022 mg ml−1. This line is plotted in Fig. 8 and is in good agreement with the Ce data between 10 and 30°C.
Although we cannot evaluate the bias in  in Fig. 9 a due to the approximation γe ≈ 1, we do not expect this bias to be large. The smallness of the deviation of γe from unity is mostly due to the low Ce in Eq. 3 and does not imply an assumption of solution ideality. In support of this conclusion, we note that three determinations of the crystallization enthalpy of lysozyme: calorimetric, based on Eq. 4, and based on Eq. 1 with an account for nonideality through a virial-type expression including forth-order concentration terms, yielded
  values within 10% of one another (Petsev et al., 2003b).
The value of  ∼ −20 kJ mol−1 is preserved between 0 and 10% acetone, whereas at 15% and 20% acetone,
  takes another consistent value of ∼− 55 kJ mol−1. The reasons for this transition will be discussed below.
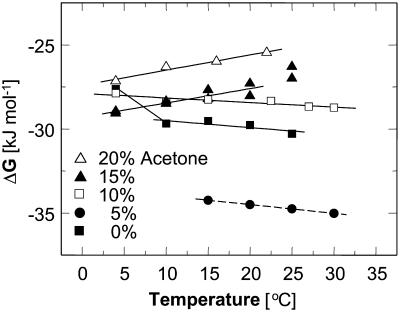
The standard free energy of crystallization  was evaluated from
 |
(5) |
resulting from a combination of Eq. 2 with  and γe ≈ 1. The resulting values of
  are shown in Fig. 10. Whereas, with the exception of the 4–10°C interval for 0 and 5% acetone, the enthalpy remains constant within the investigated temperature range,
  undergoes a linear change. This change is attributable to the entropy factor
  in the free energy expression
 |
(6) |
Evaluating  in Fig. 9 b, we find that it jumps and switches its sign from ∼35 J mol−1 K−1 at the first three acetone concentrations to ∼−110 J mol−1 K−1 at Cac = 15 and 20%.
FIGURE 10.
Temperature dependence of the crystallization free energy at five acetone concentrations. Linear fits ignore data at 25°C for Cac = 15%, and at 4°C for Cac = 0. Dashed line is a simulated line through data at Cac = 5%, calculated as discussed in the text.
DISCUSSION
The tying up of a protein molecule in a dimer, bigger cluster, or crystal is accompanied by the loss of its entropy (Hill, 1986; McQuarrie, 1976). This entropy effect, ΔSprot, consists of the loss of six (five for linear molecules) translational and rotational degrees of freedom, partially balanced by the newly created vibrational degrees of freedom (Finkelstein and Janin, 1989; Tidor and Karplus, 1994). Estimates of the magnitude of the net effect reach as high as –280 J mol−1 K−1 for the formation of the insulin dimer from two monomers (Tidor and Karplus, 1994), with a somewhat broader consensus centered at ∼−100–120 J mol−1 K−1 (Fersht, 1999; Finkelstein and Janin, 1989).
In solution, the protein molecule is encased in a shell of structured water molecules. The traditional viewpoint has been that this shell is mainly around the hydrophobic patches on the protein surface (Eisenberg and Kauzmann, 1969). It has recently been suggested that water, with the participation of ions of charge opposite to that of the local surface charges, forms structures around the polar and charged protein surface patches (Israelachvili, 1995; Leckband and Israelachvili, 2001; Manciu and Ruckenstein, 2002; Paunov et al., 2001; Petsev et al., 2000; Petsev and Vekilov, 2000).
The formation of a bond as the protein molecule joins a cluster or crystal may lead to a release of some of the water molecules and other solvent species structured at hydrophobic and hydrophilic patches. It has been suggested (Tanford, 1980) that the entropy effect of release of one water molecule is comparable to the entropy change for melting of ice—at 273 K,  = 22 J mol−1 K−1 (Dunitz, 1994; Eisenberg and Crothers, 1979; Eisenberg and Kauzmann, 1969). Similarly, estimates of the entropy loss due to the tying up of hydration water in crystals have yielded 25–29 J mol−1 K−1 (Dunitz, 1994). Thus, the release of just a few solvent molecules may completely compensate for the entropy loss due to the tying up of the protein molecule, and even render the net entropy of attachment positive.
These considerations suggest that the total change of entropy upon crystallization  divides into two components—
 |
(7) |
The similarity of the value of the  = −110 J mol−1 K−1 at high Cac to the entropy effect for tying of one protein molecule (Fersht, 1999; Finkelstein and Janin, 1989) is the basis of our assumption that
  at high acetone concentrations is an indication of the value of ΔSprot. We also assume that the entropy of a molecule in crystals grown at high Cac equals the entropy in crystal grown at low Cac. Both crystalline forms are rhombohedral. We found no evidence in literature of differences between these two forms. We carried out determination of the crystallographic lattice parameters using the atomic force microscope (Reviakine et al., 2003). The determinations indicate, with an accuracy of ∼20%, stemming from the 10–12 Å resolution of the atomic force microscopy technique in our hands and the rhombohedral lattice parameter of 49 Å (Baker et al., 1988), that the crystal forms in the presence and absence of acetone are alike (Reviakine et al., 2003). Although it is possible that similar crystals form in equilibrium with solutions containing different Cac values which have different amounts of acetone in intermolecular channels, we speculate that the chemical potential of an insulin molecule in the crystal is mostly determined by the intermolecular bonds. The similarity of the lattice parameters allows us to speculate that the intermolecular bonds are similar, and to assume that μInsulin (crystal, low Cac) ≈ μInsulin (crystal, high Cac).
On the basis of these assumptions, we evaluate the entropy effect of the release of the water upon crystallization ΔSsolvent from the difference in  at low and high Cac. Then, comparing the high value of
  = 350 J mol−1 K−1 at Cac = 0, corresponding to crystallization in the temperature range 4–10°C, to the value
  = −110 J mol−1 K−1 at Cac = 15 and 20%, get ΔSsolvent ≈ 460 J mol−1 K−1. Although higher than the value for ΔSsolvent at the higher T values at Cac = 0 and at the other Cac values, this value is lower than, e.g., for hemoglobin C and apoferritin, for which it reaches ∼600–610 J mol−1 K−1 (Vekilov et al., 2002a,b; Yau et al., 2000). Scaling this value with the above
  = 22 J mol−1 K−1, we find that this value corresponds to the release of ∼20 water molecules.
On the other hand, comparing  = 35 J mol−1 K−1 at the higher T values at Cac = 0, and at Cac = 5 and 10%, to the same
  = −110 J mol−1 K−1 at Cac = 15 and 20%, we get for ΔSsolvent = 145 J mol−1 K−1. Scaling this value with
  , we conclude that approximately six or seven water molecules are released upon the attachment of an insulin molecule to a growth site on the crystal surface. Attachment involves the creation of Z/2 = 4 molecular contacts, where Z = 8 is coordination number of a molecule in the lattice of rhombohedral crystals, such as insulin. Thus, ∼1.5–2 water molecules are released for the formation of one intermolecular bond and the entropy effect of this release contributes to the free energy of crystallization. The higher number of released waters upon crystallization at T = 4 – 10°C at Cac = 0 might indicate a greater number of hydrophobic contacts formed upon attachment to a growth site at these temperatures. The likely locations of these excess contacts are the lower and upper rims of the ringlike insulin hexamer—in the rhombohedral lattice, the hexamer rings are stacked along a threefold axis passing through the rings' centers.
The conclusion about the significance of the release of water molecules upon the attachment of an insulin molecule to a growth site allows us to define the intermolecular bonds in insulin crystal as hydrophobic (Dixit et al., 2002; Eisenberg and Crothers, 1979; Eisenberg and Kauzmann, 1969; Tanford 1961, 1980). The latter conclusion agrees with analyses based on identifying the hydrophobic surface patches form the atomic structure of the insulin molecule and comparing their orientation in the crystalline lattice (Yip et al., 1998).
The observation of a stepwise transition from  = 35 J mol−1 K−1 to
  = −110 J mol−1 K−1 as acetone concentration increases from 10 to 15%, corresponds, with the assumptions discussed above, to a transition of ΔSsolvent from 145 J mol−1 K−1 to zero. This stepwise transition suggests that the destruction of the water structure around the insulin molecules requires a threshold acetone concentration. In this sense, it is akin to a first-order phase transition in the layer surrounding the insulin molecule, with the acetone concentration as a driving force. The low acetone “phase” could be defined as structured water, replaced by a “phase” consisting of loose water + acetone at higher Cac. Note that this analogy is based on macroscopic thermodynamic data and is necessarily somewhat superficial. A deeper understanding of the thermodynamic, kinetic, and structural aspects of the solvent structures around protein molecules in aqueous, partially aqueous, and nonaqueous solutions is required for a more complete understanding of this and other features of hydrophobicity.
In accordance with the analogy to a first-order phase transition in the layer surrounding the insulin molecules, the crystallization enthalpy  also undergoes a stepwise change as Cac increases from 10 to 15%. However, one should not expect to see a shift in
  . ΔSsolvent and the corresponding enthalpy represent the total changes of S and H upon this “phase transition,” rather than the differences in H and S between the respective two standard states. Correspondingly, the total change of free energy is zero.
The sign of the enthalpy shift is somewhat unexpected. It has recently been pointed out (Chandler, 2002) that the formation of water structures around hydrophobic moieties may be accompanied by an enthalpy increase if the hydrophobic moieties are so large that the water structure cannot rearrange itself around them without the loss of several hydrogen bonds (Chandler, 2002). In view of the typical enthalpies of the O-H–O hydrogen bonds of ∼−(10–20) kJ mol−1 (Eisenberg and Crothers, 1979), this increase may be significant. If this rationale applies to insulin, one would expect the crystallization enthalpy at low Cac to include the enthalpy loss due to the reestablished H-bonds of the water released upon the formation of the hydrophobic contacts. Then, | | should decrease at higher Cac where the water structures in solution are broken before crystallization. In fact, Fig. 8 shows that |
 | increases. This discrepancy suggests that the hydrophobic patches at the surface of the insulin molecule are relatively small so that the enthalpy gain upon water structuring is low. Thus, the contribution of the enthalpy of water structuring to the shift in
  with increasing Cac is small and
  at Cac = 15 and 20% corresponds to the attachment to a crystal growth site of a molecule surrounded by a loose layer of water + acetone.
The conclusion about the existence of a structured water layer at the hydrophobic moieties on the insulin surface at low and zero acetone concentrations and its destruction at a certain acetone concentration may have consequences for the kinetics of growth of the insulin crystals. It was recently shown the kinetics of attachment of solute molecules to a growth site on the crystal surface for a broad class of crystals growing from aqueous solutions are limited by the rate of passage over a barrier due to the water molecules attached to the protein surface (Petsev et al., 2003a). One would expect that the removal of structured water molecules would be slower than the removal of loose and disordered ones, resulting in respectively slower kinetics of attachment to the growth sites and crystal growth (Makarov et al., 2000, 2002). This expectation seems to be supported by a recent determination of the kinetic coefficients for step growth of insulin crystals at conditions identical to those tested here (Reviakine et al., 2003). It was found that in the presence of acetone, the step kinetics coefficient is ∼0.5 mm s−1—an order-of-magnitude higher than that in the absence of acetone—and comparable to the kinetic coefficients of many small-molecule inorganic substances (Chernov, 1989).
Acknowledgments
We thank I. Reviakine for critical reading and numerous helpful comments on the manuscript and B. M. Pettitt for insightful suggestions.
This work is supported by the W. M. Keck Foundation, Rice University, and the Office of Biological and Physical Research, National Aeronautics and Space Administration, through grant NAG 8-1854.
References
- Atkins, P. 1998. Physical Chemistry. W. H. Freeman, New York.
- Baker, E. N., T. L. Blundell, J. F. Cutfield, S. M. Cutfield, E. J. Dodson, G. G. Dodson, D. M. Crowfoot-Hodgkin, R. E. Hubbard, N. W. Isaacs, C. D. Reynolds, K. Sakabe, N. Sakabe, and N. M. Vijayan. 1988. The structure of 2Zn pig insulin crystals at 1.5 Å resolution. Phil. Trans. R. Soc. Lond. B319:369–456. [DOI] [PubMed] [Google Scholar]
- Blundel, T. L., G. G. Dodson, D. M. Hodgkin, and D. Mercola. 1972. Insulin. In Advances in Protein Chemistry. C. B. Anfinsen, J. T. Edsall, and F. M. Richards, editors. Academic Press, New York. 279–366.
- Bradford, M. M. 1976. A rapid and sensitive method for the quantitation of microgram quantities of protein utilizing the principle of protein-dye bonding. Anal. Biochem. 72:248–254. [DOI] [PubMed] [Google Scholar]
- Brange, J. 1987. Galenics of Insulin. Springer, Berlin, Germany.
- Chandler, D. 2002. Two faces of water. Nature. 417:491. [DOI] [PubMed] [Google Scholar]
- Chernov, A. A. 1989. Growth of crystals from solutions. Contemp. Phys. 30:251–276. [Google Scholar]
- Dixit, S., J. Crain, W. C. K. Poon, J. L. Finney, and A. K. Soper. 2002. Molecular segregation observed in a concentrated alcohol-water solution. Nature. 416:829–832. [DOI] [PubMed] [Google Scholar]
- Dunitz, J. D. 1994. The entropic cost of bound water in crystals and biomolecules. Nature. 264:670. [DOI] [PubMed] [Google Scholar]
- Eisenberg, D., and D. Crothers. 1979. Physical Chemistry with Applications to Life Sciences. Benjamin/Cummins, Menlo Park, CA.
- Eisenberg, D., and W. Kauzmann. 1969. The structure and properties of water. University Press, Oxford, UK.
- Farnum, M., and C. Zukoski. 1999. Effect of glycerol on the interactions and solubility of bovine pancreatic trypsin inhibitor. Biophys. J. 76:2716–2726. [DOI] [PMC free article] [PubMed] [Google Scholar]
- Feeling-Taylor, A. R., R. M. Banish, R. E. Hirsch, and P. G. Vekilov. 1999. Miniaturized scintillation technique for protein solubility determinations. Rev. Sci. Instr. 70:2845–2849. [Google Scholar]
- Fersht, A. 1999. Structure and Mechanism in Protein Science. W.H. Freeman, New York.
- Finkelstein, A., and J. Janin. 1989. The price of lost freedom: entropy of bimolecular complex formation. Prot. Eng. 3:1–10. [DOI] [PubMed] [Google Scholar]
- Fischel-Ghodsian, F., L. Brown, E. Mathiowitz, D. Brandenburg, and R. Langer. 1988. Enzymatically controlled drug delivery. Proc. Natl. Acad. Sci. USA. 85:2403–2406. [DOI] [PMC free article] [PubMed] [Google Scholar]
- Galkin, O., and P. G. Vekilov. 2000. Control of protein crystal nucleation around the metastable liquid-liquid phase boundary. Proc. Natl. Acad. Sci. USA. 97:6277–6281. [DOI] [PMC free article] [PubMed] [Google Scholar]
- George, A., and W. W. Wilson. 1994. Predicting protein crystallization form a dilute solution property. Acta Crystallogr. D. 50:361–365. [DOI] [PubMed] [Google Scholar]
- Guo, B., S. Kao, H. McDonald, W. W. Wilson, A. Asanov, and L. L. Combs. 1999. Correlation of second virial coefficients and solubilities useful in protein crystal growth. J. Cryst. Growth. 196:424–433. [Google Scholar]
- Harding, M. M., D. C. Hodgkin, A. F. Kennedy, A. O'Connor, and P. D. J. Weitzmann. 1966. The crystal structure of insulin II. An investigation of rhombohedral zinc insulin crystals and a report of other crystalline forms. J. Mol. Biol. 16:212–226. [DOI] [PubMed] [Google Scholar]
- Harris, D. C. 2001. Exploring Chemical Analysis. J. Fiorillo, editor. W. H. Freeman & Company, China Lake, CA.
- Hill, T. L. 1986. Introduction to Statistical Thermodynamics. Dover, New York.
- Israelachvili, J. N. 1995. Intermolecular and Surface Forces. Academic Press, New York.
- Kulkarni, A. M., A. P. Chatterjee, K. S. Schweitzer, and C. F. Zukoski. 1999. Depletion interactions in the protein limit: effects of polymer density fluctuations. Phys. Rev. Lett. 83:4554–4557. [Google Scholar]
- Leckband, D., and J. Israelachvili. 2001. Intermolecular forces in biology. Quart. Rev. Biophys. 34:105–267. [DOI] [PubMed] [Google Scholar]
- Long, M. L., J. B. Bishop, T. L. Nagabhushan, P. Reichert, G. D. Smith, and L. J. DeLucas. 1996. Protein crystal growth in microgravity review of large scale temperature induction method. J. Cryst. Growth. 168:233–243. [Google Scholar]
- Makarov, V. A., B. K. Andrews, P. A. Smith, and B. M. Pettitt. 2000. Residence times of water molecules in the hydration sites of myoglobin. Biophys. J. 79:2966–2974. [DOI] [PMC free article] [PubMed] [Google Scholar]
- Makarov, V. A., B. M. Pettitt, and M. Feig. 2002. Solvation and hydration of proteins and nucleic acids: a theoretical view of simulation and experiment. Acc. Chem. Res. 35:376–384. [DOI] [PubMed] [Google Scholar]
- Manciu, M., and E. Ruckenstein. 2002. Long range interactions between apoferritin molecules. Langmuir. 18:8910–8918. [Google Scholar]
- McQuarrie, D. A. 1976. Statistical Mechanics. Harper and Row, New York.
- Pace, N. C., F. Vajdos, L. Fee, G. Grimsley, and T. Gray. 1995. How to measure and predict the molar absorption coefficient of a protein. Protein. Sci. 4:2411–2423. [DOI] [PMC free article] [PubMed] [Google Scholar]
- Paunov, V., E. Kaler, S. Sandler, and D. Petsev. 2001. A model for hydration interactions between apoferritin molecules in solution. J. Coll. Interf. Sci. 240:640–643. [DOI] [PubMed] [Google Scholar]
- Peseta, S., J. A. Langer, K. C. Zoon, and C. E. Samuel. 1989. Interferons and their actions. In Annual Review of Biochemistry. C. C. Richardson, P. D. Boyer, I. B. Dawid, and A. Meister, editors. Annual Reviews, Palo Alto, CA. 727–778.
- Peterson, K. C., J. Schlichtkrull, and K. Hallas-Meller. 1959. Injectable insulin preparation with protracted effect. US Patent No. 2,882,203.
- Petsev, D. N., K. Chen, O. Gliko, and P. G. Vekilov. 2003a. Diffusion-limited kinetics of the solution-solid phase transition of molecular substances. Proc. Natl. Acad. Sci. USA. 100:792–796. [DOI] [PMC free article] [PubMed] [Google Scholar]
- Petsev, D. N., B. R. Thomas, S.-T. Yau, and P. G. Vekilov. 2000. Interactions and aggregation of apoferritin molecules in solution: effects of added electrolytes. Biophys. J. 78:2060–2069. [DOI] [PMC free article] [PubMed] [Google Scholar]
- Petsev, D. N., and P. G. Vekilov. 2000. Evidence for non-DLVO hydration interactions in solutions of the protein apoferritin. Phys. Rev. Lett. 84:1339–1342. [DOI] [PubMed] [Google Scholar]
- Petsev, D. N., X. Wu, O. Galkin, and P. G. Vekilov. 2003b. Thermodynamic functions of concentrated protein solutions from phase equilibria. J. Phys. Chem. B. 107:3921–3926. [Google Scholar]
- Reichert, P., D. McNemar, N. Nagabhushan, T. L. Nagabhushan, S. Tindal, and A. Hruza. 1995. Metal-interferon-alpha crystals. US Patent #5,441,734.
- Reviakine, I., D. K. Georgiou, and P. G. Vekilov. 2003. Capillarity effects on the crystallization kinetics: insulin. J. Am. Chem. Soc. 125:11684–11693. [DOI] [PubMed] [Google Scholar]
- Rosenbaum, D. F., P. C. Zamora, and C. F. Zukoski. 1996. Phase behavior of small attractive colloid particles. Phys. Rev. Lett. 76:150–153. [DOI] [PubMed] [Google Scholar]
- Sauter, C., J. D. Ng, B. Lorber, G. Keith, P. Brion, M. W. Hossieni, J.-M. Lehn, and R. Giege. 1999. Additives for the crystallization of proteins and nucleic acids. J. Cryst. Growth. 196:365–376. [Google Scholar]
- Schlichtkrull, J. 1956. Insulin crystals. II. Shape of rhombohedral zinc-insulin crystals in relation to species and crystallization media. Acta Chem. Scand. 10:1459–1464. [Google Scholar]
- Schlichtkrull, J. 1957. Insulin crystals. IV. The nucleation and growth of insulin crystals. Acta Chem. Scand. 11:439–460. [Google Scholar]
- Schlichtkrull, J. 1965. Insulin rapitard and insulin actrapid. Acta Med. Scand. 177:103–113. [DOI] [PubMed] [Google Scholar]
- Schlichtkrull, J., M. Pingel, L. G. Heding, J. Brange, and K. Jorgensen. 1972. Insulin preparations with prolonged effect. In Handbook of Experimental Pharmacology. Springer, Berlin, Germany.
- Smith, D. G., E. Ciszak, and W. Pangborn. 1995. Crystallographic studies of insulin crystals grown in microgravity. Am. Instit. Phys. Conf. Proc. 325:177–182. [Google Scholar]
- Tanford, C. 1961. Physical Chemistry of Macromolecules. Wiley, New York.
- Tanford, C. 1980. The Hydrophobic Effect: Formation of Micelles and Biological Membranes. John Wiley & Sons, New York.
- Tidor, B., and M. Karplus. 1994. The contribution of vibrational entropy to molecular association. The dimerization of insulin. J. Mol. Biol. 238:405–414. [DOI] [PubMed] [Google Scholar]
- Vekilov, P. G., and A. A. Chernov. 2002. The physics of protein crystallization. In Solid State Physics. H. Ehrenreich, and F. Spaepen, editors. Academic Press, New York. 1–147.
- Vekilov, P. G., A. R. Feeling-Taylor, D. N. Petsev, O. Galkin, R. L. Nagel, and R. E. Hirsch. 2002a. Intermolecular interactions, nucleation and thermodynamics of crystallization of hemoglobin C. Biophys. J. 83:1147–1156. [DOI] [PMC free article] [PubMed] [Google Scholar]
- Vekilov, P. G., A. R. Feeling-Taylor, S.-T. Yau, and D. N. Petsev. 2002b. Solvent entropy contribution to the free energy of protein crystallization. Acta Crystallogr. D. 58:1611–1616. [DOI] [PubMed] [Google Scholar]
- Yau, S.-T., D. N. Petsev, B. R. Thomas, and P. G. Vekilov. 2000. Molecular-level thermodynamic and kinetic parameters for the self-assembly of apoferritin molecules into crystals. J. Mol. Biol. 303:667–678. [DOI] [PubMed] [Google Scholar]
- Yip, C. M., M. R. DePhelippis, B. H. Frank, M. L. Brader, and M. D. Ward. 1998. Structural and morphological characterization of ultralente insulin crystals by atomic force microscopy: evidence of hydrophobically driven assembly. Biophys. J. 75:1172–1179. [DOI] [PMC free article] [PubMed] [Google Scholar]
- Yip, C. M., and M. D. Ward. 1996. Atomic force microscopy of insulin single crystals: direct visualization of molecules and crystal growth. Biophys. J. 71:1071–1078. [DOI] [PMC free article] [PubMed] [Google Scholar]


