Abstract
An experimental study of the cationic lipid-DNA binding affinity is presented. The binding free energy was determined by monitoring lipoplex dissociation under conditions of increasing salt concentration. The primary procedure was based on the extent of quenching by energy transfer of fluorophores on DNA molecules by fluorophore on a lipid as these molecules came into close association in the lipoplex. Titration calorimetry on the Dickerson dodecamer was also done, with results that were in agreement with the fluorescence data. Measurements on short oligonucleotides allowed estimation of the binding energy per nucleotide. The binding free energy is ∼0.6 kcal/mole nucleotide for the Dickerson dodecamer and declines for longer oligonucleotides. The entropy gained upon complex formation is ∼1 entropy unit per released counterion. The method was applied to long DNA molecules (herring and λ-phage DNA) and revealed that complete dissociation occurs at 750 mM NaCl. Likely contributions of macromolecular desolvation and DNA flexibility to the binding energy are discussed.
INTRODUCTION
Since their introduction approximately 15 years ago, cationic lipids (properly, lipoids) have attracted significant interest because of their promise in gene delivery as nonviral carriers of genetic material into living cells (Felgner et al., 1987; Leventis and Silvius, 1990; Gao and Huang, 1991). They also present a challenging biophysical problem with respect to the delineation of factors that determine—via structural and energetic properties of their complexes with nucleic acids—their biological activity (Chesnoy and Huang, 2000; Safinya, 2001; Audouy and Hoekstra, 2001).
How much is known about the structure and energetics of lipoplex formation? A number of excellent experimental and theoretical studies established the equilibrium structure of lipoplexes of several different cationic amphipaths and related the structures to the properties of its components and the conditions of their formation. Upon mixing of cationic lipid and DNA, supramolecular organization of the two components changes considerably. However, the molecular structures of both are generally preserved, leading to a so-called multilamellar complex, in which DNA molecules are intercalated between intact lipid bilayers and form a tightly packed grid (Boukhnikachvilli et al., 1997; Cherezov et al., 2002; Lasic et al., 1997; MacDonald et al., 1999a; Pitard et al., 1999; Rädler et al., 1997; Smisterova et al., 2001). Other morphologies have been observed; however, they are less common than the lamellar, “sandwich” structure and are beyond the scope of this work (Koltover et al., 1998; Rosenzweig et al., 2000; Shi et al., 2002; Sternberg et al., 1994).
The thermodynamics of lipoplex formation is not well-established, although it has been conclusively demonstrated that in most cases cationic lipid-DNA binding is endothermic (Barreleiro et al., 2000; Kennedy et al, 2000; Lobo et al., 2001; Pector et al., 2000; Pozharski and MacDonald, 2002; Spink and Chaires, 1997; Zantl et al., 1999). The complete thermodynamic description of the process was only available through theoretical approaches and had not been obtained in a direct experiment (Bruinsma, 1998; Dan, 1997; Harries et al., 1998; May et al., 2000; Wagner et al., 2000). This deficiency has been remedied in this work, in which we have investigated the free energy of lipoplex formation by analyzing the dissociation of the complex at elevated ionic strength. By using relatively short oligonucleotides, we have been able to characterize the full relationship between degree of association and ionic strength, and hence determine the binding energy per nucleotide. Despite all the advances in biological and biophysical characterization of cationic lipid-DNA complexes, the relationship of their structural properties to their biological activity is still rather poorly understood. The goal of this work was to improve our understanding of the energetics underlying lipoplex formation, and thus contribute to the understanding of their interactions with membrane and other components of the living cell.
MATERIALS AND METHODS
Materials
Cationic lipid derivative, O-ethyldioleoylphosphocholine (EDOPC) was synthesized as described (MacDonald et al., 1999b). This compound is commercially available from Avanti Polar Lipids (Alabaster, AL). λDNA and herring sperm DNA were purchased from Life Technologies (Gaithersburg, MD).
The Dickerson dodecamer (5′-CGCGAATTCGCG) and four custom oligonucleotides (two pairs of complementary 20-mers and 30-mers: 5′-CCTCTGGCGCAGTTCCATCG, 5′-CGATGGAACTGCGCCAGAGG, 5′-AGTGCAACCGATGGAGTCGGACAATTGCGC, and 5′-GCGCAATTGTCCGACTCCATCGGTTGCACT) were purchased from Mega-Bases (Evanston, IL). Synthesis was on an Applied Biosystems Model 394 Biosynthesizer (Applied Biosystems, Foster City, CA). The products, purified by HPLC, were stated by the manufacturer to be 99+% pure. Oligonucleotides were either unlabeled or labeled with carboxyfluorescein at the 5′-end.
Lissamine-rhodamine-DHPE was purchased from Molecular Probes (Eugene, OR). Natural DNAs were labeled with carboxyfluorescein with a Mirus Label IT kit, purchased from PanVera LCC (Madison, WI).
Sample preparation and data collection
Most data were obtained with a fluorescence energy transfer assay; a rhodamine lipid incorporated in the liposomes quenches a carboxyfluorescein label on the DNA upon formation of the lipoplex.
Lipid vesicle suspensions were prepared according to standard procedures. Briefly, an aliquot of EDOPC stock solution was mixed with the appropriate amount of Lissamine rhodamine DHPE (both in chloroform) to give 3% w/w label incorporation. Bulk chloroform was then removed with a gentle stream of argon and the mixture was placed under high vacuum for at least 1 h. The resulting film was hydrated with buffer solution (HE: 20 mM HEPES, and 0.1 mM EDTA, pH 7.5) and briefly vortexed.
The Dickerson dodecamer presents a self-complementary sequence and was annealed by bringing to 95°C and then slowly cooling to room temperature in the final buffer solution before using it. Since the ionic strength of the solution is at least 20 mM due to the buffer, this procedure should result in double strand rather than hairpin formation, according to Marky et al. (1983). It is emphasized that oligonucleotides were then kept below their melting point under all conditions. To form double strands from complementary 20-mers and 30-mers, the following procedure was used. Various volumes of complementary oligonucleotides were mixed and the absorbance at 260 nm (A260) was measured (with proper correction for the absorbance of carboxyfluorescein, i.e., CF). A plot of A260 against the volume fraction of one of two complementary strands revealed two straight lines, the intersection of which corresponds to the precise concentrations at which no single strands remain. The final concentration of double-stranded DNA was determined by measuring A260 and assuming an extinction coefficient of 6600 M−1cm−1 (per mole of DNA phosphate).
CF emission intensity measurements were made with a microplate fluorometer (Model 7260 from Cambridge Technologies; now marketed by Perkin-Elmer Life Sciences, Boston, MA) equipped with fluorescein filters. Microplates offered the convenience of making multiple measurements at a very short time (a few seconds per well). We preferred measurements on multiple samples to titrations because it allows holding the concentrations of lipid and DNA constant in all samples, which simplified the analysis. The sensitivity of the instrument is 10−14 moles of CF, so that micromolar concentrations of DNA were easily determined. We used black microplates to minimize light transmission between wells. All experiments were conducted at room temperature (25°C).
Generally, 50 μl of DNA solution was placed in each well. CF emission intensity was measured and instrument sensitivity adjusted, if necessary. Then 50 μl of lipid suspension was added to each well and the plate incubated at room temperature for at least 1 h to assure complex formation. Upon complex formation, CF-labeled oligonucleotide is brought into close proximity to the rhodamine-labeled lipid, establishing conditions for efficient fluorescence resonance energy transfer (FRET) so that CF emission becomes quenched. The decrease in the signal verified complex formation. There was always some residual signal observed even at the lowest salt concentration, presumably due to incomplete quenching. This residual signal scaled with the total amount of DNA in the well and was therefore not due to partial dissociation of the complex.
To assess the dissociation of complexes under high ionic strength conditions, 200 μl of buffer with the appropriate salt content (produced by mixing the appropriate amount of HE and HE-HS, where HE-HS consisted of 20 mM HEPES, 0.1 mM EDTA, and 2 M NaCl at pH 7.5) was added to each well. The concentration of NaCl generally varied from zero to ∼1 M. In those wells where the complex was completely or partially dissociated, CF quenching is partially relieved because DNA dissociation from the bilayer eliminates the conditions for energy transfer. The signal at high salt conditions was slightly lower (but within 10%) of what was expected for the free DNA, an effect that we attribute to an inner filter effect due to rhodamine and some scattering due to lipid. Similarly to the incubation of complex described above, fluorescence was monitored until no further change was observed and this assured that the system reached equilibrium. The data were analyzed as described below.
Excitation/emission spectra of lipid and DNA samples and lipoplex preparations were recorded at various salt concentrations to evaluate spectral changes upon complexation and/or salt addition. No significant spectral shifts were observed under any of these conditions. As expected for FRET, quenching of fluorescein was accompanied by sensitized emission from rhodamine.
Data analysis
The main assumption of the model we use here is that oligonucleotide binding to cationic lipid is governed by thermodynamic equilibrium of the following process,
 |
(1) |
given that [D] is the free oligonucleotide (“DNA”) concentration, [L] is the concentration of the unoccupied oligonucleotide binding sites on the surface of the bilayer (“lipid”), [C] is the concentration of complex (concentration of oligonucleotide bound to lipid), and the equilibrium constant for association, or binding constant, is given by
 |
(2) |
which follows from setting the association rate of lipid and DNA equal to their dissociation rate and defining the ratio of the rate constants as K.
If [D]0 and [L]0 are “initial concentrations,” i.e., concentrations in the absence of any binding, then [L] and [C] can be expressed as
 |
(3) |
From Eqs. 2 and 3, we obtain for the degree of oligonucleotide dissociation α = [D]/[D]0,
 |
(4) |
where σ = ([L]0/[D]0 − 1) and κ = (K[D]0)−1.
If all environmental parameters except ionic strength are held constant, then the salt dependence of α is due to the salt dependence of the binding constant, K. The binding constant, in turn, is related to free energy of binding of an oligonucleotide, ΔG0, by the equation
 |
(5) |
where RT = 0.6 kcal/mole at room temperature. We initially make the simplifying assumption that the binding free energy is a linear function of ionic strength with a proportionality constant, m, so that its dependence upon NaCl concentration is given by
 |
(6) |
where ΔG00 is the standard free energy of complex formation in water. As will be seen below, the analysis verifies that this assumption is valid at the lower concentration ranges we dealt with, although there is some deviation at the highest concentrations.
All the above equations are defined in terms of oligonucleotide concentration. It is more convenient, however, to use the concentrations of electronic charges on the DNA and lipid, for this allows specification of the size of the DNA binding site, a parameter undefined up to this point. If a double-stranded oligonucleotide carries N negative charges, then [D]0 should be replaced with the DNA charge concentration [D]′ = N[D]0. Assuming isoelectric binding, the lipid charge concentration is given by [L]′ = N[L]0, and the DNA binding site hence becomes equivalent in size to the area of N lipid molecules. The free energy of binding should also be scaled to refer to single DNA charge as ΔG0′ = ΔG0/N. Note that this approach assumes the DNA binds as a single unit. As will be seen in the Discussion, this is true for small oligonucleotides but not for large pieces of DNA.
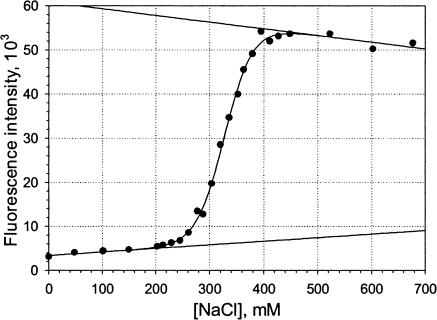
To accurately relate F, the measured emission of CF, to the degree of dissociation, α, the relationship between ionic strength and CF emission must be known. On the basis of the findings that 1), the low-salt region of the emission versus ionic strength curve (see Fig. 1) was always linear, and 2), the CF emission of free oligonucleotides was linearly related to ionic strength over the entire range used (data not shown), we take F to be a linear function of ionic strength for both bound and free states. Lipid alone had no contribution to the measured signal, chiefly because rhodamine does not significantly emit into the spectral window in our experiments.
FIGURE 1.
Example of the salt dependence of the fluorescence of CF-labeled Dickerson dodecamer in complex with cationic lipid EDOPC. 3 μM DNA, 12 μM EDOPC. Low- and high-salt baselines and the binding curve are obtained from fitting.
Using the model described above, the experimental data (CF emission, F, in arbitrary units as a function of NaCl concentration, [NaCl]) were fit to the following equations.
 |
(7) |
The adjustable parameters in these equations are ab, bb, ad, bd, and ΔG150 (the binding free energy per mole of compensated charge in the complex at 150 mM NaCl concentration) and m. The first four are related to instrument settings and spectroscopic properties of the fluorescent labels and they define the relationship between CF emission and degree of dissociation, α. The last two parameters, ΔG150 and m, are of primary interest in this work. The assumptions made in deriving the expressions in Eq. 7 are discussed below.
Fitting was performed by least-square minimization using the optimization procedure of SigmaPlot 2000 (SPSS, Chicago, IL) software. All six parameters were adjusted simultaneously to obtain the best fit. Estimates of the parameters and standard errors were obtained via procedures implemented in the software.
Isothermal titration calorimetry
Isothermal titration calorimetry experiments were performed using a MicroCal isothermal titration calorimeter MSC-ITC (Northampton, MA) (Wiseman et al., 1989). Cationic lipid-DNA binding enthalpy was determined for the titration of 0.46 mM Dickerson dodecamer into 25 μM EDOPC in HE-S buffer (of 20 mM HEPES, 0.1 mM EDTA, and 150 mM NaCl at pH 7.5). Dilution heat was determined separately. The binding curve was analyzed using MicroCal Origin software to fit the data to a one-site model. Concentration was scaled to represent the number of oligonucleotide molecules and the fitting results were then scaled to values referring to single DNA charge.
RESULTS
Dickerson dodecamer
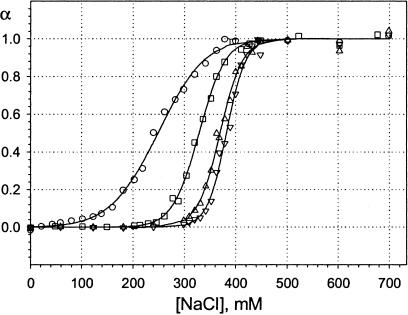
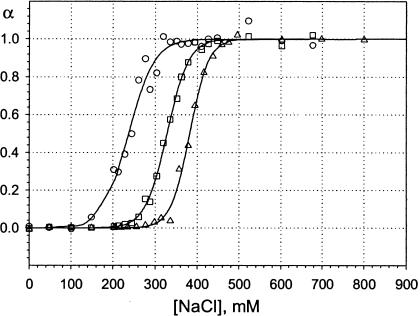
An example of a binding curve is shown in Fig. 1. The straight lines represent the baseline, the parameters of which were obtained by fitting the experimental data to the expressions in Eq. 7. Fig. 2 shows binding curves obtained at different lipid:DNA mixing ratios from 2:1 to 16:1. The degree of dissociation, α, deduced from the original data by subtracting baseline values, is plotted against NaCl concentration. The DNA concentration was 3 μM for all of these curves and the different stoichiometries are a result of increasing concentrations of the lipid. The shift of the curves toward higher ionic strength is mostly attributable to the increase of the concentration of the components, although some increase of the binding free energy was also observed, as discussed below. The effect of concentration on the binding curve is more clearly illustrated in Fig. 3, where data for the same lipid:DNA charge ratio as in Fig. 2 (4:1), but three different total concentrations, are shown.
FIGURE 2.
Binding curves for the same DNA concentration (3 μM) but different lipid:DNA charge ratios: ○, 2:1; □, 4:1; ▵, 8:1; and ▿, 16:1. Baselines obtained from fitting are subtracted; the line represents fitting results.
FIGURE 3.
Binding curves for the same lipid:DNA charge ratios (4:1) but different DNA concentrations: ○, 1 μM; □, 3 μM; and ▵, 12 μM. Baselines obtained from fitting are subtracted; the line represents fitting results.
Binding curves were obtained under a total of 12 different conditions. Results of fitting these data to the expressions in Eq. 7 are presented in Table 1. The free energies shown correspond to the 150 mM salt concentration that is typical for lipoplex applications involving gene delivery to cells. The critical salt concentration, [NaCl]cr, was obtained by extrapolation to zero of the linear salt dependence of the free energy. In other words, it represents the hypothetical salt concentration at which the lipoplex formation would become thermodynamically unfavorable, under the assumption that linearity in free energy dependence on salt concentration holds up to that point.
TABLE 1.
Thermodynamic parameters for binding of the Dickerson dodecamer to EDOPC as determined by fitting of the experimental binding data to Eq. 7
| DNA concentration, μM
|
||||
|---|---|---|---|---|
| Lipid:DNA charge ratio | 1 | 3 | 12 | |
| 2:1 | ΔG150 | −460 ± 36 | −459 ± 4 | −465 ± 11 |
| m | 0.52 ± 0.18 | 0.70 ± 0.03 | 0.71 ± 0.05 | |
| [NaCl]cr | 1036 ± 245 | 805 ± 25 | 806 ± 35 | |
| 4:1 | ΔG150 | −498 ± 22 | −542 ± 12 | −598 ± 21 |
| m | 1.19 ± 0.20 | 1.02 ± 0.07 | 1.17 ± 0.09 | |
| [NaCl]cr | 568 ± 53 | 680 ± 23 | 660 ± 21 | |
| 8:1 | ΔG150 | −565 ± 25 | −595 ± 23 | −592 ± 11 |
| m | 1.25 ± 0.15 | 1.16 ± 0.11 | 1.12 ± 0.04 | |
| [NaCl]cr | 600 ± 36 | 664 ± 27 | 679 ± 10 | |
| 16:1 | ΔG150 | −605 ± 12 | −631 ± 29 | −629 ± 31 |
| m | 1.33 ± 0.06 | 1.33 ± 0.13 | 1.29 ± 0.12 | |
| [NaCl]cr | 604 ± 11 | 625 ± 24 | 638 ± 20 | |
Generally, the binding free energy was found to be quite constant within the concentration ranges we explored. It should be noted that the binding curve obtained with 2:1 lipid excess over 1 μM DNA showed some dissociation even at low salt conditions and therefore the baseline cannot be reliably estimated in this case. However, we have found that thermodynamic parameters derived from the fitting show only weak dependence upon the estimate of the baseline.
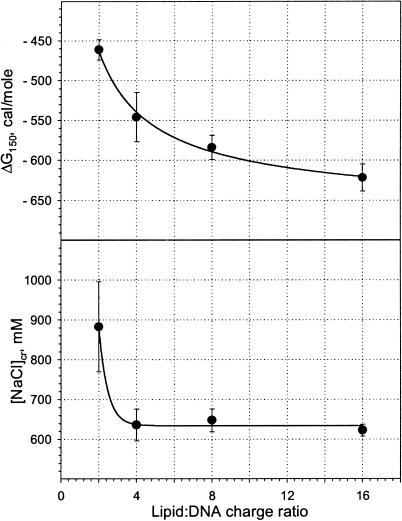
Two independent thermodynamic parameters (ΔG150 and [NaCl]cr) are plotted in Fig. 4 against the lipid:DNA charge ratio. Noteworthy is that the critical salt concentration underwent a large decrease when the charge ratio was increased from 2 to 4, but was constant for larger values of lipid excess. The free energy of lipoplex formation decreased monotonically with increasing charge ratio, although most rapidly for the change in lipid:DNA charge ratio from 2 to 4.
FIGURE 4.
Thermodynamic parameters of binding of the Dickerson dodecamer to the cationic lipid EDOPC as a function of the lipid:DNA charge ratio. Plotted are: ΔG150, the binding free energy in the presence of 150 mM salt (top); and [NaCl]cr, the critical NaCl concentration that corresponds to the zero binding free energy (bottom). Lines are guides to the eye.
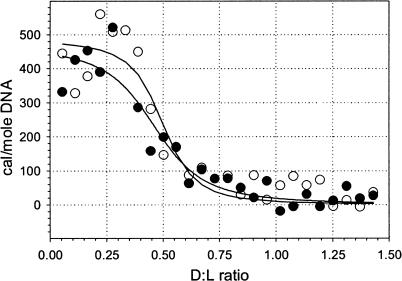
In a separate experiment, we studied cationic lipid-DNA binding thermodynamics using isothermal titration calorimetry. The results—again for the Dickerson dodecamer—are shown in Fig. 5 as the heat absorbed at various ratios of D/L. Averaged over two runs, thermodynamic parameters of the binding are ΔG = −445 ± 20 cal/mole, and ΔH = 477 ± 42 cal/mole. The binding stoichiometry corresponds to a lipid:DNA ratio of 2.13 ± 0.14 and thus the free energy should be compared to that obtained by the binding assay at L:D = 2, which is ΔG150,2:1 = −461 ± 17 cal/mole, in good agreement with ITC data. The binding enthalpy is comparable to the one carefully determined in our previous work for the binding of longer DNA to EDOPC (Pozharski and MacDonald, 2002).
FIGURE 5.
Calorimetric profile of cationic lipid-DNA binding. 460 μM of Dickerson dodecamer titrated into 25 μM EDOPC suspension in HE-S (20 mM HEPES, 150 mM NaCl, and 0.1 mM EDTA, at pH 7.5). Dilution heat was determined separately and subtracted. Curves are from fitting to a one-site binding model; unfilled and solid circles correspond to two independent titrations.
Longer oligonucleotides
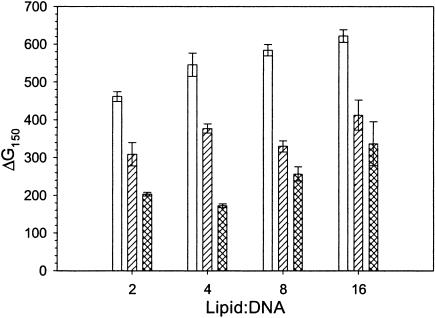
Results obtained with oligonucleotides of 20 and 30 basepairs are summarized in Table 2. The most striking feature is the decrease of the apparent free energy of lipoplex formation with increasing length of the DNA fragment. This is illustrated more clearly in Fig. 6, where the average ΔG150 is shown for all four charge ratios. Averaging the entire pool of data obtained for each oligonucleotide yields the following values: −553 ± 20, −357 ± 19, and −242 ± 39 cal/mole, for the 12-, 20-, and 30-mer, respectively.
TABLE 2.
Thermodynamic parameters of the binding of custom oligonucleotides, 20-, and 30-basepairs long (see Materials and Methods), to EDOPC as determined by fitting of the experimental binding data to Eq. 7
| DNA concentration, μM | ||||
|---|---|---|---|---|
| Lipid:DNA charge ratio | 1, 20 bp | 3, 20 bp | 3, 30 bp | |
| 2:1 | ΔG150 | −280 ± 7 | −338 ± 18 | −203 ± 5 |
| m | 0.37 ± 0.04 | 0.94 ± 0.15 | 0.21 ± 0.02 | |
| [NaCl]cr | 906 ± 63 | 510 ± 40 | 1109 ± 66 | |
| 4:1 | ΔG150 | −380 ± 21 | −374 ± 11 | −172 ± 5 |
| m | 1.07 ± 0.15 | 0.92 ± 0.07 | 0.43 ± 0.07 | |
| [NaCl]cr | 504 ± 30 | 555 ± 19 | 553 ± 54 | |
| 8:1 | ΔG150 | −325 ± 19 | −334 ± 20 | −257 ± 19 |
| m | 0.52 ± 0.09 | 0.69 ± 0.10 | 0.88 ± 0.14 | |
| [NaCl]cr | 771 ± 73 | 633 ± 45 | 440 ± 26 | |
| 16:1 | ΔG150 | −448 ± 34 | −377 ± 14 | −337 ± 58 |
| m | 0.99 ± 0.14 | 0.52 ± 0.04 | 0.58 ± 0.18 | |
| [NaCl]cr | 604 ± 29 | 879 ± 33 | 731 ± 82 | |
Column titles specify DNA concentration and oligonucleotide length, in basepairs (bp).
FIGURE 6.
Dependence of lipoplex formation free energy, ΔG150 on the lipid:DNA charge ratio. Bars correspond to the Dickerson dodecamer: 12-(unfilled), 20-(hatched), and 30-(crosshatched) basepair-long oligonucleotides.
Natural DNA molecules
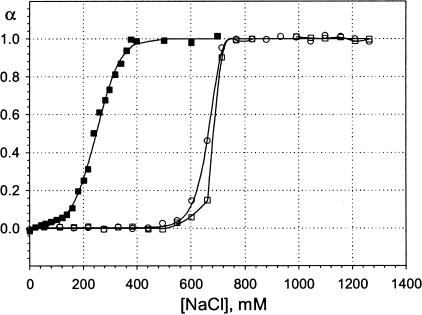
Binding curves for two naturally occurring DNA molecules were also examined. The DNA concentration was held at 2 μM and lipid was in excess by 2:1. The herring sperm DNA sample is a mixture of DNA molecules of different sizes, whereas λDNA is homogeneous. The binding curves for these two molecules are shown in Fig. 7, together with the binding curve for the Dickerson dodecamer at 3 μM concentration shown for comparison.
FIGURE 7.
Binding isotherms for lipoplexes formed with natural DNA molecules. Lipid:DNA charge ratio was 2:1 for all the curves. The DNA concentration was 2 μM, except for the Dickerson dodecamer, included for comparison, for which it was 3 μM. ▪, Dickerson dodecamer; ○, herring sperm DNA; and □, λ-phage DNA. Curve for Dickerson dodecamer is obtained from fitting, others are guides to the eye.
λDNA exhibits a narrow transition, as would be expected, given its homogeneity. The transition in the case of the herring sperm DNA is somewhat broader than that of the λDNA and is presumably also related to the heterogeneity of this sample. It is noteworthy that curves for both natural DNAs exhibit maxima at approximately the same salt concentration; this means that, despite the large differences in DNA size and morphology, some binding still occurs for virtually any DNA sample up to salt concentration of ∼750 mM.
DISCUSSION
Preliminary considerations
The primary experimental result presented here is the measurement of the extent of association of DNA and cationic lipid surfaces, from which free energies of association were derived. Dissociation of the lipoplex was obtained by increasing the ionic strength. Because the overall approach involves implicit assumptions about influences of lipoplex heterogeneity and structural and morphological changes of components under high ionic strength, we discuss these first.
If lipoplex preparations are, as we know is the case, heterogeneous, then what precisely does the binding energy determined in this work refer to? This potential problem, in fact, dictated our choice of lipid excess as a mandatory condition for the experiment, because otherwise it would be impossible to separate contributions from lamellar lipoplex and DNA-coated vesicle structures (Boukhnikachvilli et al., 1997; Huebner et al., 1999; Kennedy et al., 2000). Under lipid excess conditions there is only macroscopic heterogeneity (i.e., lipoplexes may be of different sizes) whereas the microscopic structure of lamellar cationic lipid-DNA “sandwich” is uniform as demonstrated by diffraction techniques (Lasic et al., 1997; Rädler et al., 1997; MacDonald et al., 1999a). It is this microscopic structure that determines binding affinity. Accordingly, we determine in our experiment how much free energy is released as a result of interaction of a single DNA charge with a lipid bilayer. The free energy of binding is extrapolated to physiological salt conditions and, unless there are unrecognized problems with such a procedure, the approach provides information that is independent of the structure of complex, released lipid and DNA at high salt. It should be recognized, though, that this does not mean that changes in structure or organization of the lipoplex and its components are necessarily absent upon formation of the complex. It is known that there are changes in DNA conformation upon lipoplex formation and that the liposomes are broken (under our conditions) upon complexation. Thus, to the extent these processes contribute a significant free energy change, they would become lumped into the overall free energy change that we measured.
Entropy-driven lipoplex formation
It has been shown previously that EDOPC lipoplex formation is endothermic, i.e., the enthalpy of complex formation, ΔH, is positive. Since, for any process to be thermodynamically favored, the free energy change must be negative,
 |
it is clear that lipoplex formation must be driven by an increase of entropy. The association of cationic lipid and DNA at physiological ionic strength (and below) is very tight and therefore one can expect that under those conditions, the entropic term will be large and determining.
We have shown elsewhere (Pozharski and MacDonald, 2002) that the enthalpy change per mole of lipid in lipoplex formed at typical temperatures is ∼1 RT (600 cal/mole). The present study shows that the overall free energy of binding is of about the same magnitude, thus leading to the conclusion that the entropic term in the above equation should be ∼2 RT per mole of complex. The direct determination of the binding entropy in the ITC experiment presented in this work is in agreement with this estimate.
What is the source of this entropy gain upon lipoplex formation? It is currently widely accepted that the major contribution comes from counterion release. Bruinsma first pointed out that lipoplex formation is not simply driven by electrostatic attraction between oppositely charged DNA polymer and lipid membrane and that, in fact, the situation is more complex, because both components exist in solution with oppositely charged counterions bound to them and these are released upon complex formation (Bruinsma, 1998). Hence, the DNA-lipid electrostatic attraction merely replaces the two sets of counterion interactions; however, the energy change in the direction of complex formation is unfavorable, because the binding enthalpy is positive. The counterions increase their entropy when they are released and, according to Bruinsma, this entropy gain is expected to be ∼1 kT per counterion. Our data are thus quite consistent with this prediction.
Although counterion release must involve an entropy gain upon lipoplex formation, it is appropriate to inquire whether this is the only cause of entropy change. In particular, we might inquire about a possible role of hydration. Hirsch-Lerner and co-workers have shown that both cationic lipid and DNA become partially dehydrated upon complex formation (Hirsch-Lerner and Barenholz, 1999); such phenomenon should lead to an additional entropy gain due to the additional degrees of freedom acquired by the released water. In addition, the released counterions interact more strongly with water and restrict somewhat the mobility of the water molecules around them, an effect that must lead to some entropy loss (one can show that this is comparable to the above gain of the translational entropy of the counterions). Moreover, the DNA, and to a smaller extent, the lipid bilayer, must undergo some reduction in entropy because of loss of degrees of freedom due to increased rigidity of the complex relative to the separate components (these contributions seem small; see next section). Given these other possible contributions, particularly changes in bound water, and the uncertainty about the extent to which they cancel each other, it is doubtful that we can assign the observed lipoplex formation entropy entirely to the counterion release. What we may say with confidence, of course, is that the net change due to effects of electrostatic interactions and water electrostriction is positive with a magnitude of ∼2 kT per pair of interacting DNA and lipid charges.
Excess lipid produces stronger binding
Fig. 4 shows that binding becomes more favorable with decreasing cationic lipid:DNA charge ratio. The stronger interaction between 2:1 and 4:1 is actually expected, since the DNA spacing at these two ratios is somewhat different, so the complex structure must also be quantitatively different. The difference is, in essence, due to a stronger DNA-DNA repulsion at low lipid content. (As we have suggested elsewhere, this repulsion may actually make a positive contribution to the enthalpy change during lipoplex formation; Pozharski and MacDonald, 2002). On the other hand, the strengthening of binding at even higher L:D ratios, especially from 8:1 to 16:1, is surprising for the following reasons. At least in the case of DOTAP complexes, it has been shown by Safinya and co-workers that the DNA spacing in the complex rises to a maximum when lipid becomes in excess; that is, adding extra lipid does not change lipoplex structure because this lipid exists as free bilayer (Koltover et al., 1999). Accordingly, excess lipid should not affect the binding energy.
One possible explanation of the continuing decrease of ΔG up to a charge ratio of 16:1 is that lipoplexes with excess lipid actually have stronger lipid-DNA interactions. For example (assuming that the free bilayer is actually part of the lipoplex particle and not as separate vesicles), there may be internal edge effects such that it is easier to accommodate the boundary of DNA-covered areas when there is more lipid. Alternatively, it is possible that oligonucleotides are better dispersed throughout the lipoplex particle than are DNA molecules, because the smaller oligonucleotides would gain a larger amount of translational entropy by such dispersal than would the much larger DNA molecules. The nonlinearity of the salt dependence of binding free energy over the range of ionic strength that was examined may also contribute, as discussed in the next section.
Salt dependence of the free energy of lipoplex formation is nonlinear at elevated ionic strength
The assumption of linear salt dependence of the free energy of lipoplex formation constitutes the minimal hypothesis and it allowed estimation of the thermodynamic parameters of cationic lipid-DNA binding. Other functions are certainly possible and some, such as ln(c) or  , could be justified on various theoretical grounds, but it must be recognized that the relationship between lipid bilayer and DNA helix during lipoplex formation or dissociation is complicated and it is by no means obvious how salt concentration should affect it. A linear relationship was the simplest choice and it was revealed by the fitting procedure to be generally satisfactory (we must emphasize that different salt dependencies are virtually indistinguishable in fitting of experimental data—because of the relatively narrow transition region—but may produce different estimates of the binding free energy when extrapolated to lower salt concentrations). The implication thereof is that the slope of the dependence changes slowly, if at all, when ionic strength is elevated (if the slope is approximately constant within transition region of any given binding curve, then the data would fit the equations we derived). Since it could well be that linearity of the salt effect is a reasonable approximation only over a limited range of ionic strength, we next ask, “does linearity hold a more extended range of ionic strength?”
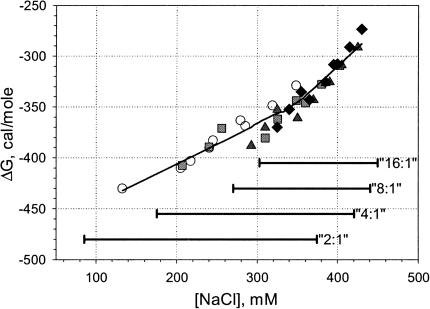
To answer this question, we determined by interpolation the salt concentrations at which one-third, one-half, and two-thirds of the complex is dissociated for each of the 12 binding curves obtained for Dickerson dodecamer. We emphasize that no assumption is made at this step about the salt dependence of free energy, and the degree of complex dissociation α is obtained directly from experimental data. The binding constant can then be estimated for each specific condition as (see Data Analysis subsection in Materials and Methods for definitions)
 |
(8) |
The binding free energy per mole of charge, ΔG, can then be calculated as (RT/N)log(NK), where N = 24 is the number of charges per oligonucleotide. These values are plotted against salt concentration in Fig. 8. The horizontal bars represent the salt concentration range covered for each lipid:DNA ratio by the binding curves obtained for the three different concentrations.
FIGURE 8.
The salt dependence of the binding free energy. The solid line results from smoothing the data and is provided as a guide to the eye. Horizontal bars represent the salt concentration range where partial dissociation was observed for any given lipid:DNA ratio.
The nonlinearity of the overall salt dependence of the binding free energy is clearly visible in Fig. 8. The slope increases for the ionic strength exceeding ∼350 mM. This provides yet another explanation for the increase in the binding free energy upon adding extra lipid, since it shifts the whole binding curve toward higher salt concentrations. There are several possible reasons for this effect of salt, including steric (the ions occupy a finite volume), electrostatic (counterions will repel one another), and dehydration (the water activity is reduced at higher salt concentrations), among, presumably, others.
Multipoint nature of cationic lipid-DNA interactions
The binding of an individual DNA electrostatic charge to the lipid membrane is, according to our experimental findings, rather weak. Indeed, at physiological salt concentrations the binding constant of the single nucleotide would be ∼0.4 M−1. The binding of an entire DNA molecule is, however, quite strong because of the presence of multiple, simultaneous interactions. In other words, a DNA molecule binds to the lipid membrane at many points and the relatively small free energies of the individual charges sum to a very large binding energy for the whole molecule.
As the comparison of different DNA molecules in Fig. 7 shows, size does indeed affect binding energy. Accordingly, we chose short oligonucleotides for measurement so that the binding free energy per binding unit was low enough to be accurately determined; that is, with oligonucleotides, the electrolyte concentration range over which the degree of dissociation varied was sufficiently wide that accurate fitting could easily be accomplished.
As will be seen below, it is likely that an oligonucleotide as short as the Dickerson dodecamer binds as a single unit. But is this true for the whole DNA molecule, or is the binding unit in such cases only a part of the molecule? To answer this question, we inquire as to what prevents part of a DNA molecule from being separated from the bilayer membrane. As has been long understood in the case of the adhesion of random chain macromolecules to surfaces (Silberberg, 1975 ), all of the units of a polymeric molecule like DNA must bind together because they are covalently linked, even though all individual units need not bind simultaneously. Although a DNA molecule could bind as a whole because it was located within the lipoplex structure and parallel to the surface of the lipid membrane, the stiffness of real DNA is finite, so the actual size of the binding unit must be limited and, except for very short oligonucleotides, considerably shorter than the contour length of the DNA. As we show in the Appendix, the bending energy prevents the ends of the dodecamer from separating from the bilayer, whereas for the 20-mer it becomes somewhat possible, and almost no such restriction obtains in the case of 30-mer.
The increase in the apparent binding energy per nucleotide for longer DNA fragments (Table 2) is hence explicable on the basis of the flexibility of the DNA molecule. Our analysis of the binding curves was based on the concept that oligonucleotides bind as a whole and when that condition is not satisfied, the situation is more complicated. It should be emphasized that it would be rather involved to assess this partial unbinding of the single DNA fragment experimentally because a displacement of several nm is required to abrogate the condition of FRET. Nevertheless, in general, the decrease of the apparent binding energy per nucleotide unit of the oligonucleotides is expected because the ends of the longer molecules will be less associated and hence reduce the overall binding. The binding free energies per oligonucleotide molecule are –(13.3 ± 0.5), –(14.3 ± 0.8), and –(14.5 ± 2.3) kcal/mole for the 12-, 20-, and 30-mer, respectively, suggesting that dodecamer is perhaps close to the size of the “binding unit.”
Finally, we address the question of the contribution of entropy loss upon DNA adsorption (see Netz and Andelman, 2003, for a review) on the surface of the lipid membrane. Within the random-walk model of a polymer chain, the entropy loss can be estimated as ∼N, where N is the number of segments of the polymer chain (each segment is ∼a Å long, where a is the DNA persistence length). Hence, the contribution of the reduced dimensionality of the system into the free energy of binding is ∼3.5 Å RT/(2a) ∼2 cal/mole (assuming DNA persistence length a = 500 Å; Podgornik et al., 2000; Williams and Rouzina, 2002). It is small in comparison with the overall binding free energy, and our results obtained on short oligonucleotides are therefore applicable to longer stretches of DNA, provided, of course, that account is taken of the effects of flexibility and the possibility that not all of a long molecule need be bound simultaneously.
CONCLUSIONS
The main question we have addressed in this work is the strength of binding of DNA to the cationic lipid matrix upon lipoplex formation. Our study showed that this binding is, in fact, rather weak on the basis of the free energy released per pair of mutually compensated lipid and DNA charges. The binding free energy is ∼1 RT per mole of the lipoplex, which would correspond to some 25% dissociation of a given pair of charges at any one time. However, the amount of free lipid and DNA is much smaller because of the multisite nature of the binding. Single lipid molecules cannot dissociate from the complex since they are held in bilayers by strong hydrophobic interactions and thus form a continuous matrix to which DNA can bind. DNA bases are covalently linked to each other and the stiffness of the polymer is such that a molecule only about as short as a dodecamer binds as a single unit. As a result, much more free energy is released upon a binding event and this brings the apparent dissociation constant into micromolar range at physiological ionic strength. Longer DNA molecules bind more tightly, of course, but their energy of interaction is also limited by their flexibility.
The absolute value of the binding constant provides information on the energetics of binding. Taking into account the previously established binding enthalpy, we can conclude that the entropy gain upon lipoplex formation is ∼1 kT per released counterion, and that this positive ΔS is the driving force of the process, in good agreement with theoretical considerations.
Acknowledgments
We are very grateful to Jaime Stearns for the synthesis of some of the EDOPC.
This research was supported by National Institutes of Health grant GM 52329.
APPENDIX
The bending free energy of a polymer is
 |
(9) |
In this equation, R and T have their usual meanings, a is the persistence length, L the total length, and Rc the radius of the bend. Assume an N bp stretch of DNA binds at its midpoint to the lipid surface. Given constant curvature, the separation, X, of the ends of the molecule from the membrane is
 |
(10) |
Equation 10 may be recast by using Eq. 8, defining g = ΔGb/RT, incorporating the nucleotide spacing d = L/N = 3.5 Å, and recognizing that g ≪ 2a/Nd ≈ 370/N for dodecamers or longer. The result is
 |
(11) |
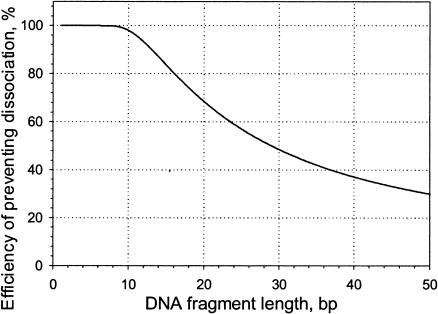
Assuming a 3 Å separation is equivalent to dissociation, the bending free energies are 1.5, 0.3, and 0.1 kcal/mole for the dodecamer, 20-, and 30-mer, respectively. The percentage of the DNA remaining in contact with the lipid was calculated and is shown in Fig. 9. It is to be understand as follows: if the value for the 20-mer is, e.g., 68%, then ∼68% of the fluctuations that would otherwise cause unbinding of that part of the DNA from the lipid bilayer are, in fact, precluded by the bending energy barrier. We thus conclude that the dodecamer is effectively bound to the membrane as a whole, whereas there is reasonable probability for portions of the longer DNA fragments to dissociate from the surface.
FIGURE 9.
The effect of DNA stiffness in reducing partial dissociation from the bilayer. See the Appendix for details.
Because of their increased ability to bend, very long molecules will exhibit an even lower tendency to remain attached throughout their length, but because the number of contact sites is high, the extent of dissociation for long DNA molecules at moderate and low ionic strength is extremely small.
Edwin Pozharski's current address is Brandeis University, Rosenstiel Basic Medical Research Center, MS-029, 415 South St., Waltham, MA 02454-9110.
References
- Audouy, S., and D. Hoekstra. 2001. Cationic lipid-mediated transfection in vitro and in vivo. Mol. Membr. Biol. 18:129–143. [PubMed] [Google Scholar]
- Barreleiro, P. C. A., G. Olofsson, and P. Alexandridis. 2000. Interaction of DNA with cationic vesicles: a calorimetric study. J. Phys. Chem. B. 104:7795–7802. [Google Scholar]
- Boukhnikachvilli, T., O. Aguerre-Chariol, M. Airiau, S. Lesieur, M. Ollivon, and J. Vacus. 1997. Structure of in-serum transfecting DNA-cationic lipid complexes. FEBS Lett. 409:188–194. [DOI] [PubMed] [Google Scholar]
- Bruinsma, R. 1998. Electrostatics of DNA-cationic lipid complexes: isoelectric instability. Eur. Phys. J. B. 4:75–88. [Google Scholar]
- Cherezov, V., H. Qiu, V. Pector, M. Vandenbranden, J. M. Ruysschaert, and M. Caffrey. 2002. Biophysical and transfection studies of the diC(14)-amidine/DNA complex. Biophys. J. 82:3105–3117. [DOI] [PMC free article] [PubMed] [Google Scholar]
- Chesnoy, S., and L. Huang. 2000. Structure and function of lipid-DNA complexes for gene delivery. Annu. Rev. Biophys. Biomol. Struct. 29:27–47. [DOI] [PubMed] [Google Scholar]
- Dan, N. 1997. Multilamellar structures of DNA complexes with cationic liposomes. Biophys. J. 73:1842–1846. [DOI] [PMC free article] [PubMed] [Google Scholar]
- Felgner, P. L., T. R. Gadek, M. Holm, R. Roman, H. W. Chan, M. Wenz, J. P. Northrop, G. M. Ringold, and M. Danielsen. 1987. Lipofection: a highly efficient, lipid-mediated DNA transfection procedure. Proc. Natl. Acad. Sci. USA. 84:7413–7417. [DOI] [PMC free article] [PubMed] [Google Scholar]
- Gao, X., and L. Huang. 1991. A novel cationic liposome reagent for efficient transfection of mammalian cells. Biochem. Biophys. Res. Commun. 179:280–285. [DOI] [PubMed] [Google Scholar]
- Harries, D., S. May, W. M. Gelbart, and A. Ben-Shaul. 1998. Structure, stability and thermodynamics of lamellar DNA-lipid complexes. Biophys. J. 75:159–173. [DOI] [PMC free article] [PubMed] [Google Scholar]
- Hirsch-Lerner, D., and Y. Barenholz. 1999. Hydration of lipoplexes commonly used in gene delivery: follow-up by laurdan fluorescence changes and quantification by differential scanning calorimetry. Biochim. Biophys. Acta. 1461:47–57. [DOI] [PubMed] [Google Scholar]
- Huebner, S., B. J. Battersby, R. Grimm, and G. Cevc. 1999. Lipid-DNA complex formation: reorganization and rupture of lipid vesicles in the presence of DNA as observed by cryoelectron microscopy. Biophys. J. 76:3158–3166. [DOI] [PMC free article] [PubMed] [Google Scholar]
- Kennedy, M. T., E. V. Pozharski, V. A. Rakhmanova, and R. C. MacDonald. 2000. Factors governing the assembly of cationic phospholipid-DNA complexes. Biophys. J. 78:1620–1633. [DOI] [PMC free article] [PubMed] [Google Scholar]
- Koltover, I., T. Salditt, J. O. Rädler, and C. R. Safinya. 1998. An inverted hexagonal phase of cationic liposome-DNA complexes related to DNA release and delivery. Science. 281:78–81. [DOI] [PubMed] [Google Scholar]
- Koltover, I., T. Salditt, and C. R. Safinya. 1999. Phase diagram, stability, and overcharging of lamellar cationic lipid-DNA self-assembled complexes. Biophys. J. 77:915–924. [DOI] [PMC free article] [PubMed] [Google Scholar]
- Lasic, D. D., H. Strey, M. C. A. Stuart, R. Podgornik, and P. M. Frederik. 1997. The structure of DNA-liposome complexes. J. Am. Chem. Soc. 119:832–833. [Google Scholar]
- Leventis, R., and J. R. Silvius. 1990. Interactions of mammalian cells with lipid dispersions containing novel metabolizable cationic amphiphiles. Biochim. Biophys. Acta. 1023:124–132. [DOI] [PubMed] [Google Scholar]
- Lobo, B. A., A. Davis, G. Koe, J. G. Smith, and C. R. Middaugh. 2001. Isothermal titration calorimetric analysis of the interaction between cationic lipids and plasmid DNA. Arch. Biochem. Biophys. 386:95–105. [DOI] [PubMed] [Google Scholar]
- MacDonald R. C., G. W. Ashley, M. M. Shida, V. A. Rakhmanova, Y. S. Tarakhovsky, D. P. Pantazatos, M. T. Kennedy, E. V. Pozharski, K. A. Baker, R. D. Jones, H. S. Rosenzweig, K. L. Choi, R. Qiu, and T. J. McIntosh. 1999a. Physical and biological properties of cationic triesters of phosphatidylcholine. Biophys. J. 77:2612–2629. [DOI] [PMC free article] [PubMed] [Google Scholar]
- MacDonald, R. C., V. A. Rakhmanova, K. L. Choi, H. S. Rosenzweig, and M. K. Lahiri. 1999b. O-ethylphosphatidylcholine: a metabolizable cationic phospholipid which is a serum-compatible DNA transfection agent. J. Pharm. Sci. 88:896–904. [DOI] [PubMed] [Google Scholar]
- Marky, L. A., K. S. Blumenfeld, S. Kozlowski, and K. J. Breslauer. 1983. Salt-dependent conformational transitions in the self-complementary deoxydodecanucleotide d(CGCGAATTCGCG): evidence for hairpin formation. Biopolymers. 22:1247–1257. [DOI] [PubMed] [Google Scholar]
- May, S., D. Harries, and A. Ben-Shaul. 2000. The phase behavior of cationic lipid-DNA complexes. Biophys. J. 78:1681–1697. [DOI] [PMC free article] [PubMed] [Google Scholar]
- Netz, R. R., and D. Andelman. 2003. Neutral and charged polymers at interfaces. Phys. Rpt. Rev. Phys. Lett. 380:1–95. [Google Scholar]
- Pector, V., J. Backmann, D. Maes, M. Vandenbranden, and J.-M. Ruysschaert. 2000. Biophysical and structural properties of DNA/DIC14-amidine complexes: influence of the DNA/lipid ratio. J. Biol. Chem. 275:29533–29538. [DOI] [PubMed] [Google Scholar]
- Podgornik, R., P. L. Hansen, and V. A. Parsegian. 2000. Elastic moduli renormalization in self-interacting stretchable polyelectrolytes. J. Chem. Phys. 113:9343–9350. [Google Scholar]
- Pozharski, E., and R. C. MacDonald. 2002. Thermodynamics of cationic Lipid-DNA complex formation as studied by isothermal titration calorimetry. Biophys. J. 83:556–565. [DOI] [PMC free article] [PubMed] [Google Scholar]
- Pitard, B., N. Oudrhiri, J. P. Vigneron, M. Hauchecorne, O. Aguerre, R. Toury, M. Airiau, R. Ramaswamy, D. Scherman, J. Crouzet, J. M. Lehn, and P. Lehn. 1999. Structural characteristics of supramolecular assemblies formed by guanidinium-cholesterol reagents for gene transfection. Proc. Natl. Acad. Sci. USA. 96:2621–2626. [DOI] [PMC free article] [PubMed] [Google Scholar]
- Rädler, J. O., I. Koltover, T. Salditt, and C. R. Safinya. 1997. Structure of DNA-cationic liposome complexes: DNA intercalation in multilamellar membranes in distinct interhelical packing regimes. Science. 275:810–814. [DOI] [PubMed] [Google Scholar]
- Rosenzweig, H. S., V. A. Rakhmanova, T. J. McIntosh, and R. C. MacDonald. 2000. O-Alkyl dioleoylphosphatidylcholinium compounds: the effect of varying alkyl chain length on their physical properties and in vitro DNA transfection activity. Bioconjug. Chem. 11:306–313. [DOI] [PubMed] [Google Scholar]
- Safinya, C. R. 2001. Structures of lipid-DNA complexes: supramolecular assembly and gene delivery. Curr. Opin. Struct. Biol. 11:440–448. [DOI] [PubMed] [Google Scholar]
- Shi, F., L. Wasungu, A. Nomden, M. C. Stuart, E. Polushkin, J. B. Engberts, and D. Hoekstra. 2002. Interference of poly(ethylene glycol)-lipid analogues with cationic-lipid-mediated delivery of oligonucleotides; role of lipid exchangeability and non-lamellar transitions. Biochem. J. 366:333–341. [DOI] [PMC free article] [PubMed] [Google Scholar]
- Silberberg, A. 1975. Structure and properties of macromolecular surface phases. Disc. Faraday Soc. 71:203–207. [Google Scholar]
- Smisterova, J., A. Wagenaar, M. C. Stuart, E. Polushkin, G. ten Brinke, R. Hulst, J. B. Engberts, and D. Hoekstra. 2001. Molecular shape of the cationic lipid controls the structure of cationic lipid/dioleylphosphatidylethanolamine-DNA complexes and the efficiency of gene delivery. J. Biol. Chem. 276:47615–47622. [DOI] [PubMed] [Google Scholar]
- Spink, C. H., and J. B. Chaires. 1997. Thermodynamics of the binding of a cationic lipid to DNA. J. Am. Chem. Soc. 119:10920–10928. [Google Scholar]
- Sternberg, B., F. L. Sorgi, and L. Huang. 1994. New structures in complex formation between DNA and cationic liposomes visualized by freeze-fracture electron microscopy. FEBS Lett. 356:361–366. [DOI] [PubMed] [Google Scholar]
- Wagner, K., D. Harries, S. May, V. Kahl, J. O. Rädler, and A. Ben-Shaul. 2000. Direct evidence for counterion release upon cationic lipid-DNA condensation. Langmuir. 16:303–306. [Google Scholar]
- Williams, M. C., and I. Rouzina. 2002. Force spectroscopy of single DNA and RNA molecules. Curr. Opin. Struct. Biol. 12:330–336. [DOI] [PubMed] [Google Scholar]
- Wiseman, T., S. Williston, J. F. Brandts, and L.-N. Lin. 1989. Rapid measurement of binding constants and heats of binding using a new titration calorimeter. Anal. Biochem. 179:131–137. [DOI] [PubMed] [Google Scholar]
- Zantl, R., L. Baicu, F. Artzner, I. Sprenger, G. Rapp, and J. O. Rädler. 1999. Thermotropic phase behavior of cationic lipid-DNA complexes compared to binary lipid mixtures. J. Phys. Chem. B. 103:10300–10310. [Google Scholar]


