Abstract
Electrochemistry and polarization modulation Fourier transform infrared reflection absorption spectroscopy (PM-FTIRRAS) was employed to investigate fusion of small unilamellar vesicles of 1,2dioyl-sn-glycero-3-phosphatidyl choline (DOPC) onto the Au(111) electrode. Electrochemical studies demonstrated that the DOPC vesicles fuse and spread onto the gold electrode surface at small charge densities −8 μC cm−2 < σM < 0 μC cm−2(if the static electric field is <2 × 10⁸ V/m) to form a bilayer. At σM < −8 μC cm−2, the film is detached from the electrode surface; however, the film remains in close proximity to the surface. The PM-FTIRRAS experiments demonstrated that the field-driven transformation of the film involves changes in hydration, orientation, and conformation in the polar headgroup region and that changes in the packing and tilt of the acyl chains are consequences of the headgroup rearrangements.
INTRODUCTION
Lipids and proteins in natural biological membranes are frequently exposed to static electric fields of the order of 107 V/m–108 V/m (Tsong and Astumian, 1988) that regulate the activity of many membrane proteins (Lakey and Slatin, 2001; Zakharov et al., 2002). Most of the present knowledge concerning the effect of the electric field on the membrane properties comes from measurements of average properties such as the transmembrane potential (Azzone et al., 1984), ζ-potential (McLaughlin, 1977), membrane conductivity, or capacity using bilayer lipid membranes (Coronado, 1986; Tien, 1974) and cell or liposome fragments immobilized at the tip of a micropipette using the patch-clamp method (Corey, 1983; Tien and Ottova-Leitmannova, 2000). Less is known about the effect of the electric field on the membrane structure at a molecular level. Spectroscopic, diffraction, and imaging techniques have to be employed to determine structure and require a larger and more constrained sample than a bilayer lipid membrane or a clamped patch of a cell membrane or liposome.
Membranes supported on solid surfaces are the most suitable models for structural studies. They are conveniently formed by fusion of small unilamellar vesicles (SUVs) to a hydrophilic surface of quartz or glass (Sackmann, 1996). To apply an electric field to the membrane, it has to be supported on a conductive substrate. The strategies used to build a model biological membrane at a surface of a metal electrode have been reviewed recently (Guidelli et al., 2001). Many studies have been performed on phospholipids deposited at a mercury electrode by extruding the drop of mercury through a monolayer spread on the gas-solution interface (Buoninsegni et al., 1998; Bizzotto and Nelson, 1998; Miller, 1981; Nelson and Benton, 1986; Nelson and Bizzotto, 1999). More recently SUVs have been fused either at a mercury (Stauffer et al., 2001) or at a gold electrode surface (Horswell et al., 2002). Another approach involves formation of hybrid bilayers by depositing a monolayer of a phospholipid onto a monolayer of thiols tethered to a gold electrode surface (Lingler et al., 1997; Buoninsegni et al., 1998; Plant, 1999; Lang et al., 1994; Krysinski et al., 2001). Investigations of transmembrane proteins require matrices with a water reservoir on the two sides of the bilayer. Such molecular architectures have been built by fusing SUVs onto a gold electrode with tethered thiol monolayers, terminated with hydrophilic end groups or hydrophilic chains (Cornell et al., 1997; Williams et al., 1997; Raguse et al., 1998; Stora et al., 1999; Becucci et al., 2002; Naumann et al., 2003a,b). Many studies of biomimetic membranes at electrode surfaces have aimed at the development of a bioelectrochemical sensor and concerned the investigation of their barrier properties.
It has been observed that thin films of phospholipid molecules deposited at an electrode surface undergo a potential-controlled phase transition (Nelson and Benton, 1986; Leermakers and Nelson, 1990; Bizzotto et al., 1999). However, little work has been done to describe structural changes that accompany these phase transformations using spectroscopic techniques. Recently, Le Saux et al. (2001) employed polarized attenuated total reflection (ATR) spectroscopy to study the influence of the electric field on the orientation of phospholipid molecules in phospholipid multilayers sandwiched between two germanium electrodes. Independently, Horswell et al. (2002) applied photon polarization modulation infrared reflection absorption spectroscopy (PM-IRRAS) to investigate the electric field-driven transformations of a bilayer of dimyristoylphosphatidylcholine (DMPC) formed at a gold electrode surface.
The aim of the present study is to use polarization modulation Fourier transform infrared reflection absorption spectroscopy PM-FTIRRAS to describe the electric field driven changes in the structure of a bilayer formed by 1,2di-oleoyl-sn-glycero-3-phosphatidyl choline (DOPC, di-oleoyl lecithin) at an Au(111) electrode surface. This work is a continuation of the study initiated by (Horswell et al., 2002). However, we have made significant methodological improvements that allowed us to measure absorption bands of the phosphate and choline groups. In addition, we have developed protocols to determine the angle between the direction of the transition dipole corresponding to a given vibration and the direction normal to the surface. With the help of these advances, herein we will provide the first quantitative description of the influence of the electric field on the orientation and hydration of the polar head region of the DOPC molecule and the packing and conformation of its acyl chains. Gold was chosen as a support for the DOPC bilayer, because at the interface with an electrolyte solution, it behaves as a capacitor over a broad range of applied potentials. In addition, the choice of a single crystal material ensured that charge was homogenously distributed across the electrode surface. The (111) orientation corresponds to the energetically most stable plane of a gold single crystal.
EXPERIMENTAL PROCEDURE
Reagents, solutions, and electrodes
A 0.05 M NaF (Suprapur, Merck, Darmstadt, Germany) solution was used as the supporting electrolyte. All aqueous solutions were prepared from ultrapure water, purified by a Milli-Q UV Plus (>18.2 MΩ cm) water system (Millipore, Bedford, MA). Some IR experiments were performed in deuterated water solutions (D2O, Cambridge Isotope Laboratories, Cambridge, MA). All electrolyte solutions were de-aerated by purging with argon (BOC Gases, Mississauga, Ontario, Canada) for at least 20 min before starting the measurements. Argon was allowed to flow over the solution at all times. The gold (111) single crystal electrodes used in the electrochemical and the infrared experiments were grown, oriented, cut and polished in our laboratory. Before the experiments, the gold electrodes were cleaned by flame annealing and quenched with ultrapure water. A coil made of either Pt wire or Pt foil served as counter electrodes in the electrochemical and PM-IRRAS measurements, respectively. A saturated calomel electrode was used as the reference electrode in the electrochemical experiments and an Ag/AgCl (3M KCl) reference electrode (E = −40 mV versus the saturated calomel electrode) was used in IRRAS measurements. In this article, all potentials are reported on the Ag/AgCl scale. 1,2dioyl-sn-glycero-3-phosphatidyl choline (DOPC) was purchased from Nutfield Nurseries (South Nutfield, UK) and used without further purification. The chain-melting temperature Tc of DOPC is −22°C (Israelachvili, 1985). All measurements were carried out at room temperature (20 ± 2°C).
Preparation of DOPC vesicles
The procedure described by (Barenholtz et al., 1977) was used to prepare SUVs. A solution of 0.14 mL of a 20 mg ml−1 chloroform/methanol stock solution (i.e., 2.8 mg, 3.6 μmol) and 0.5 mL chloroform (Aldrich, ACS HPLC grade, Milwaukee, WI) was dried by vortexing in a test tube under a stream of argon. The dried DOPC lipid was then kept for at least 1 h in a vacuum desiccator to remove the solvent. Next, 2.6 mL of de-aerated 0.05 M NaF base electrolyte was added and the mixture was sonicated for 1 h at a temperature of 30° (usually the mixture became translucent after 20–30 min). The dynamic light-scattering measurements performed on these solutions showed that the diameter of the vesicles ranged between 30 and 60 nm. Finally, the solution of vesicles was injected into the electrochemical or the IR cell containing the supporting electrolyte to yield a final concentration of DOPC ∼6 × 10⁻⁵ mol L−1.
Electrochemical measurements
All electrochemical measurements were carried out in an all-glass three-electrode cell using the working electrode in the hanging meniscus configuration (Dickertmann et al., 1976). The cleanliness of the base electrolyte was checked by cyclic voltammetry and differential capacitance measurements using the experimental procedures described previously (Richer and Lipkowski, 1985). The cyclic voltammetry curves were recorded at a scan rate of 20 mV s−1. The differential capacity curves were determined using a scan rate of 5 mV s−1 and an AC perturbation of 25 Hz frequency and 5 mV rms amplitude. A computer-controlled system, consisting of a HEKA potentiostat/galvanostat PG 490, a scan generator ESG310 (HEKA, Lambrecht/Pfalz, Germany) and a 7265 DSP lock-in amplifier (EG&G Instruments, Cypress, CA) was employed to perform electrochemical experiments. All data were acquired via a plug-in acquisition board (RC Electronics, Santa Barbara, CA) and in-house software. The differential capacity curves were calculated from the in-phase and the out-of-phase components of the AC current using a series RC equivalent circuit.
Chronocoulometry was used to determine the charge density at the electrode surface. The gold electrode was held at a base potential Eb = −800 mV for 30 s. Then the potential was stepped to a variable potential of interest, Ef, where the electrode was held for a time tf (at least 70 s) while stirring the solution to achieve a complete spreading of vesicles at the electrode surface. A potential step to the desorption potential Edes = −1.20 VAg/AgCl was then applied. The current transient was recorded during 200 ms and the potential was stepped back to Eb. The stirring was interrupted 10 s before the potential step from Ef to Edes was applied. The integration of the current transients gives the difference between charge densities at potentials Ef and Edes. Similar experiments were performed at the electrode in a solution without the vesicles. The absolute charge densities were then calculated using the independently determined potential of zero charge, Epzc = 310 mV versus Ag/AgCl, and the procedure described in Richer and Lipkowski (1985). The charge density data presented in this article are the average of up to 20 measurements.
Spectra collection and processing
The Nexus 870 (Nicolet, Madison, WI) spectrometer, equipped with an external tabletop optical mount, High D* MCT-A detector, photoelastic modulator (PM-90 with II/ZS50 ZnSe 50 kHz optical head, Hinds Instruments, Hillsboro, OR), and demodulator (Synchronous Sampling Demodulator, GWC Instruments, Madison, WI) was used to perform PM-FTIRRAS experiments. The spectra were acquired using in-house software, an Omnic macro and digital-to-analog converter (Omega, Stamford, CT) to control the potentiostat (HEKA PG285) and to collect spectra. The IR window was a BaF2 1-inch equilateral prism (Janos Technology, Townshend, VT). Before the experiment, the window was washed in water and methanol and then cleaned for 10 min in an ozone chamber (UVO cleaner, Jelight, Irvine, CA.). When the spectroelectrochemical cell was assembled, DOPC vesicles prepared in D2O or H2O were injected into the cell. After 1 h, the DOPC bilayer was formed on the Au(111) electrode surface. The working electrode was set at a starting potential E = −1.00 V versus the Ag/AgCl reference electrode and spectra were collected at a series of potentials, which were programmed as a cyclic sequence of steps whose amplitude was progressively increased using 0.05 or 0.2 V potential increments. In total, 20 cycles of 400 scans each were performed to give 8000 scans at every applied potential. The instrumental resolution was 2 cm−1. At the end of the measurement, the blocks of scans were individually checked for anomalies, using in-house software, before averaging.
Measurements of IR spectra were carried out with the photoelastic modulator (PEM) set for half-wave retardation at 2900 cm−1 for the CH stretching region. A 2400–3200 cm−1 bandpass filter was employed and the angle of incidence of the infrared beam was set to 53°. The electrolyte thickness between electrode and prism was ∼5.8 μm, giving comparable intensities of p- and s-polarized light at the electrode surface. In this way, we were able to remove absorbance originating from vesicles dissolved in the electrolyte solution. In the C=O stretching and CH bending region, the maximum PEM efficiency was set to 1600 cm−1. The angle of incidence was 60° and the electrolyte thickness was ∼6.0 μm. In the phosphate group stretching region, the maximum PEM efficiency was set at 1200 cm−1 or 1000 cm−1, the angle of incidence was 57°, and the thickness of the gap 6.4 μm. The thickness of the thin layer was determined by comparing the experimental reflectivity spectrum of the thin layer cell, attenuated due to the layer of solvent between the electrode and the IR window, to the reflectivity curve calculated from the optical constants of the cell constituents, as described in Li et al. (2002).
The demodulation technique developed in Corn's laboratory (Green et al., 1991; Barner et al., 1991) was used in this work. After demodulation, two signals were measured: i), the averaged intensity IA(ω) and ii), the intensity difference ID(ω). The two signals have to be corrected for the PEM response functions. A procedure that is a modified version of a method described earlier by Buffeteau et al. (2000) was employed to calculate the PEM response functions. The details of the calculations and the calculated PEM response functions are described in Zamlynny et al. (2003). The signals IA(ω) and ID(ω) have to be corrected further for the difference between optical throughputs of the optical setup for p- and s-polarized light (Buffeteau et al., 2000; Zamlynny et al., 2003). The ratio of the throughputs of the optical setup for p- and s-polarized light was equal to 1.06 (Zamlynny et al., 2003).
Finally, when in situ experiments are performed in a thin layer cell that contains electrolyte, the measured spectrum has a background due to the absorption of the IR beam by the aqueous solution in the thin layer. To correct the spectra for the background, a baseline was built for each spectrum using a spline interpolation technique (Zamlynny et al., 2003). The same data points were used to build the spline for all the spectra. When all these corrections are introduced, the background corrected spectrum plots ΔS, which is proportional to absorbance A of the adsorbed molecules:
 |
(1) |
where Γ is the surface concentration of the adsorbed species and ɛ is the decimal molar absorption coefficient of the adsorbed species.
Computational detail
An ab initio prediction of the geometry and harmonic vibrational frequencies of an isolated DOPC molecule was made using the Gaussian98 program suite (Frisch et al., 2001). Due to the relatively large size of the DOPC molecule, C44H84NO8P, the Hartree-Fock method with the split-valence 3-21G* basis set was adopted. The initial starting geometries of the hydrocarbon chains were modeled after the crystal structure of the low melting form of oleic acid (Abrahamson and Ryerstedt-Nahringhauer, 1962). The predicted harmonic vibrational frequencies were scaled by 0.9085 (Scott and Radom, 1996) before comparison with experimental values. Normal modes of intensity >105 km/mol were inspected visually using the Gaussview program. The modes were assigned to atomic motions and the directions of the dipole moment transition vector noted for each intense vibration. These assignments were used in the interpretations of the PM-IRRAS measurements particularly for the phosphate group stretches.
RESULTS AND DISCUSSION
Electrochemical properties
DOPC is a zwitterionic molecule. When a bilayer of these molecules is adsorbed on the gold electrode surface, the field acting on the membrane is chiefly due to the charge present on the metal surface (σM). The dependence of the field F on charge density is described by the Gauss theorem:
 |
(2) |
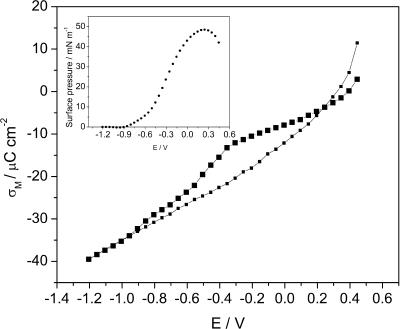
The charge densities on the metal surface can be measured using the chronocoulometric method (Richer and Lipkowski, 1985). Fig. 1 shows charge density plotted versus potential of the gold electrode in the absence and in the presence of the DOPC vesicles. The curve recorded in the presence of DOPC changes slowly in the range of σM from –8 to ∼0 μC cm−2 (between ∼0.3 and ∼−0.4 V (Ag/AgCl). Outside this region, the charge densities either drop or rise and the curve recorded in the presence of DOPC starts to merge with the curve of the supporting electrolyte. This behavior indicates that the bilayer is detached from the gold surface at these large charge densities. Assuming that the thickness of the bilayer is ∼5 nm, one can estimate that the bilayer is stable at the electrode surface when the field is <6 × 10⁷ V m−1 and is detached from the metal when the field is >∼2 × 10⁸ V m−1. Clearly, by depositing the bilayer of DOPC at the gold electrode surface, one can investigate the behavior of this model membrane in the presence of fields that are comparable in magnitude to the fields acting at a natural biological membrane (Tsong and Astumian, 1988).
FIGURE 1.
Charge density σM versus potential E curves at the Au(111) electrode in 0.05 M NaF (open squares) and 0.05 M NaF + 6 × 10⁻⁵ M DOPC (filled squares). (Inset) Surface pressure Π versus potential E plots calculated from the charge density plots (Lipkowski and Stolberg, 1992).
The slope of the charge-potential curve corresponds to the differential capacity of the electrode C. The values of the differential capacity may be used to estimate the coverage of the electrode surface by the bilayer using the formula (Damaskin et al., 1971):
 |
(3) |
where Cbase and Cperfect are the capacities of the film-free surface and the perfect (defect-free) bilayer, respectively. At E = 70 mV (Ag/AgCl) the capacities Cbase and C are equal to 32 μF cm−2 and 5.8 μF cm−2, respectively. The capacity of the defect-free bilayer is ∼0.8 μF cm−1 (Guidelli et al., 2001). From these data, one can estimate that the coverage of the gold surface by the membrane amounts to ∼84%. This result suggests that the vesicles spread at the gold electrode surface form rafts similar to the behavior observed earlier for spreading vesicles on mica (Reviakine and Brisson, 2000; Leonenko et al., 2000; Pignataro et al., 2000).
The area between the charge density curves for the supporting electrolyte and the DOPC vesicles containing electrolyte corresponds to the surface pressure of the bilayer that can be calculated using the following equation (Lipkowski and Stolberg, 1992):
 |
(4) |
where γ0 and γ are the surface energies and σM and σM0 are the charge densities in the absence and presence of vesicles in the solution, respectively. The surface pressure curve is shown in the inset to Fig. 1. The surface pressure plot is bell shaped with a maximum of ∼48 mN m−1 at E ≈ 175 mV. This value is very close to the film pressure of a solution of DOPC at the air/solution interface equal to 52 mN m−1 (Tajima and Gershfeld, 1985). Overall, spreading of DOPC at the gold electrode surface displays many similarities to the spreading of DMPC described in our previous work (Horswell et al., 2002).
Optical constants and band assignment
The integrated intensity of a band in the absorption spectrum of DOPC adsorbed at a gold electrode surface is proportional to the square of the dot product of the transition dipole moment (μ) and the electric field (E) of the photon (Allara and Swalen, 1982; Allara and Nuzzo, 1985; Zamlynny et al., 2003):
 |
(5) |
where θ is the angle between the directions of the electric field of the photon and the transition dipole. At the gold electrode surface, the direction of the p-polarized photon is normal to the surface. For randomly oriented molecules, cos2 θ = 1/3. The direction of the transition dipole of a given IR band may be determined by calculating the spectrum for randomly oriented molecules from isotropic optical constants, using the formula (Allara and Nuzzo, 1985; Lipert et al., 1998):
 |
(6) |
where Aexp is the measured background-corrected absorbance of the DOPC membrane at the electrode surface (see Eq. 1) and Acal is the absorbance calculated from the optical constants for reflection from the gold electrode surface using the optical matrix method (Allara and Swalen, 1982; Popenoe et al., 1992; Zamlynny et al., 2003). The angle θ calculated with the help of Eq. 6 is an average value. In the interpretation of θ, we will assume a very narrow range of orientation in the molecule population around the measured angle. Once the direction of the transition dipole with respect to the surface normal is known, the orientation of the DOPC molecules in the film may be determined by relating the direction of the transition dipole to the geometry of the molecule. In the interpretation of the IR data, we will assume that the electric field at the surface does not affect the absolute value of the transition dipole and the changes in the integrated band intensity will be discussed in terms of the reorientation of the molecule. This approximation is widely used in the IR studies of field-driven transformations in thin films at electrode surfaces (Li et al., 2002).
To calculate Acal, the DOPC film was assumed to be a 4.5 nm thick bilayer (Tristram-Nagle et al., 1998) of randomly oriented molecules. The optical constants for Au and BaF2 were taken from Palik (1998). The optical constants for H2O and D2O were taken from Bertie et al. (1989). The isotropic optical constants for DOPC were determined from transmission spectra, using the procedure described in two recent studies (Li et al., 2002; Zamlynny et al., 2003). The transmission spectra of DOPC vesicles in D2O, H2O, and CCl4 were measured in flow cell, consisting of two BaF2 flat windows separated by an ∼25 μm thick Teflon spacer. The DOPC concentration in D2O and H2O was 0.443 (v/v) % and in CCl4 0.664 (v/v) %.
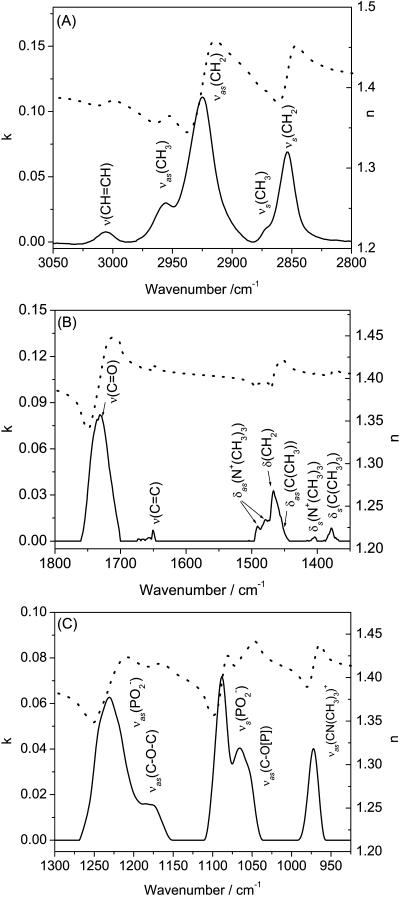
The optical constants are plotted in Fig. 2. Panel A shows the CH stretching region, panel B the C=O stretching and CH bending region, and panel C the phosphate group stretching region. The attenuation coefficient k was determined from the transmission spectra and the refractive index was then calculated from k using the Kramers-Kroenig transformation and an iterative procedure described in Allara and Swalen (1982), Popenoe et al. (1992), and Li et al. (2003). The average refractive index at infinite frequency n∞ = 1.4 (Frey and Tamm, 1991; Flasch et al., 1997) was used for the whole spectral region.
FIGURE 2.
Isotropic optical constants of DOPC calculated from the transmittance of its 0.443 (v/v) % solution in (A and B) D2O and (C) H2O. (A) CH stretching region, (B) C=O stretching region, and (C) PO stretching region. n (dotted lines) refractive index; k (solid lines)attenuation coefficient.
The plots of k are used for band assignment. In Fig. 2 A, the band at 3006.5 ± 0.4 cm−1 corresponds to CH stretching in the unsaturated oleoyl group, the bands at 2957.5 ± 0.2 cm−1 and 2870.7 ± 0.4 cm−1 to the asymmetric and symmetric stretches of the methyl group, and the bands at 2927.5 ± 0.2 cm−1 and 2854.7 ± 0.4 cm−1 to the asymmetric and symmetric stretches of the methylene group, respectively.
Fig. 2 B shows the C=O stretch at ∼1730 cm−1 and a busy spectral region between 1550 cm−1 and 1300 cm−1, where the CH bending bands are located. The asymmetric bending bands (δas) of the methyl groups attached to the nitrogen atom of the choline moiety are located at 1492 cm−1 and 1481 cm−1. The symmetric bending modes (δs) of the methyl in the choline moiety are seen at 1404 cm−1 and 1371 cm−1. The bending modes of terminal methyl groups in the hydrocarbon chains appear at 1457 cm−1 for the asymmetric and at 1378 cm−1 for the symmetric bend. The symmetric band overlaps with the lower frequency symmetric mode of the choline moiety.
Finally, Fig. 2 C shows the bands of the phosphate group. The asymmetric  band appears at ∼1230 cm−1. The symmetric
  stretch is located at 1090 cm−1. The asymmetric vibrations of the ester groups, vas(C-O-C) and
  , could be seen at ∼1180 and at ∼1063 cm−1, respectively. They overlap with the corresponding asymmetric and symmetric phosphate group stretches. The asymmetric stretch of the CN bond in the choline group vas(CN(CH3)3+) is observed at 970 cm−1.
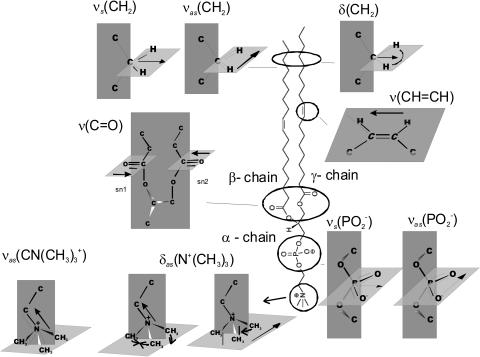
Fig. 3 shows a model of the DOPC molecule and the directions of the transition dipoles for the major bands in the IR spectrum of this molecule (Fringeli, 1977; Fringeli and Gunthard, 1981). This information will be used throughout to discuss the effect of the electric field at the interface on the orientation and conformation of DOPC molecules in this model of a biological membrane.
FIGURE 3.
Schematic diagram of the DOPC molecule and the directions of the transition dipole moments analyzed in the text.
PM-IRRAS studies
We organize the description of the IR spectra for the bilayer of DOPC at the gold electrode surface by discussing the polar head first and the hydrocarbon tail region next. The discussion of the head region is further divided into sections devoted to the ester, the phosphate, and the choline group bands. To discuss hydration and solvent effects, the PM-IRRAS bands for the bilayer deposited at the Au(111) electrode surface are compared with the corresponding bands in an aqueous suspension of vesicles (D2O or H2O) and a solution of DOPC in CCl4 measured in transmission.
The headgroup region
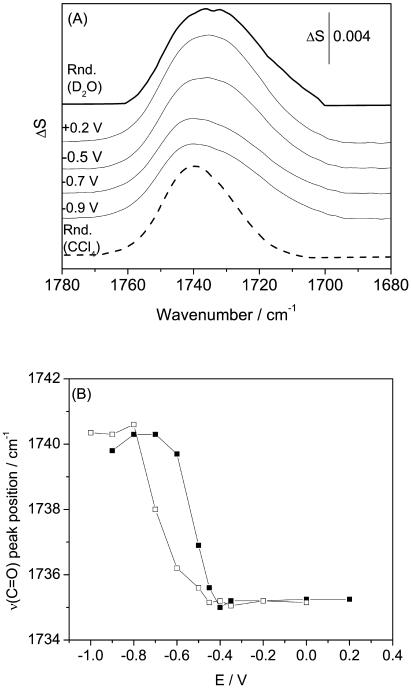
C=O group. The IR absorption band of the carbonyl ester group stretch ν(C=O) of a phospholipid molecule is centered at ∼1730 cm−1. The exact position and the shape of this band depend on hydration of the polar region of the lipid and on polarity of the surrounding medium (Fringeli, 1977; Blume et al., 1988; Hubner and Blume, 1998). This point is illustrated by the two transmission spectra in Fig. 4 A where the top curve (thick solid line) plots the C=O stretching band in DOPC vesicles dispersed in D2O and the bottom curve (dashed line) shows the band for a solution of DOPC in CCl4. In the dispersion of DOPC vesicles, the ν(C=O) is a composite band that may be deconvoluted into two bands with maxima at 1741 and 1727 cm−1. The high and low frequency components of this band were initially assigned to the conformational nonequivalence of acyl groups esterified in the sn1 and sn2 positions of the glycerolipid moiety, respectively (Levin et al., 1982; Mansch and McElhaney, 1991). However, more recent studies (Blume et al., 1988; Lewis et al., 1994) provided convincing arguments that the two ester groups are equivalent and that splitting of the ν(C=O) band is caused by the partial hydration of the ester groups. The maxima at ∼1742 cm−1 and ∼1728 cm−1 are now assigned to the nonhydrated and hydrated carbonyl ester groups, respectively. Indeed, the band of DOPC dissolved in a nonpolar solvent such as CCl4 is dominated by the peak at ∼1740 cm−1, corresponding to the nonhydrated ester group. The shoulder seen on the low frequency side of this band is due to the presence of residual water of hydration.
FIGURE 4.
(A) PM-FTIRRA spectra in the ν(C=O) stretching region of a DOPC bilayer on an Au(111) electrode in 0.1 M NaF/D2O solution at potentials indicated on the figure. Thick lines spectra calculated for 4.5 nm thick DOPC bilayer in different environments: (solid lines) D2O; (dashed line) CCl4 solution. (B) Dependence of the position of the maximum absorption frequency of ν(C=O) stretch on electrode potential in a DOPC on an Au(111) surface; (filled squares) positive and (open squares) negative potential step.
In Fig. 4 A, four traces between the two transmission spectra plot the v(C=O) bands for the DOPC bilayer at the Au(111) electrode surface. They illustrate the influence of the electrode potential (electric field) on the C=O stretching region in the IR spectrum. Clearly, the shape of this band and the position of its center change with E. The position of the band maximum is plotted against the electrode potential in Fig. 4 B. In the potential range from −1.0 to −0.7 V (σM < −25 μC cm−2), the band has its maximum at 1740.4 ± 0.3 cm−1, close to the position of the v(C=O) in an aprotic solvent such as CCl4. The band is asymmetric and has a shoulder on the low-frequency side. These features indicate that absorption by the nonhydrogen-bonded ester group dominates at these negative potentials.
In the range of E between −0.7 and −0.4 V (−10> σM > −25 μC cm−2), the shoulder grows and the band maximum shifts toward lower frequencies. At E > −0.4 V (σM > −10 μC cm−2), the band becomes more symmetric and its maximum is red-shifted to 1735 cm−1. Its shape resembles that of the v(C=O) band in an aqueous suspension of vesicles. A further increase of the potential up to 0.2 V has no effect on the band position and shape. A hysteresis is seen in the band intensity-potential plot. Its presence indicates that the band position depends somewhat on the direction in which the potential is changed and that the field-driven transformations of the bilayer are kinetically hindered. Similar hysteresis has been observed for thin films of lipids deposited at an Au(111) electrode surface (Bizzotto et al., 1999, Horswell et al., 2002).
The changes of the shape and the position of the v(C=O) band center indicate that the hydration of the ester group in the DOPC bilayer supported at the gold electrode surface depends on the electrode potential (static electric field). The ester groups are less hydrated when the bilayer is detached from the electrode surface at E < −0.7 V (σM < −25 μC cm−2) than when it is adsorbed at the electrode at E > −0.4 V (|σM| < 10 μC cm−2). This behavior is consistent with previous PM-FTIRRAS studies of a DMPC bilayer at a gold electrode surface by Horswell et al. (2002).
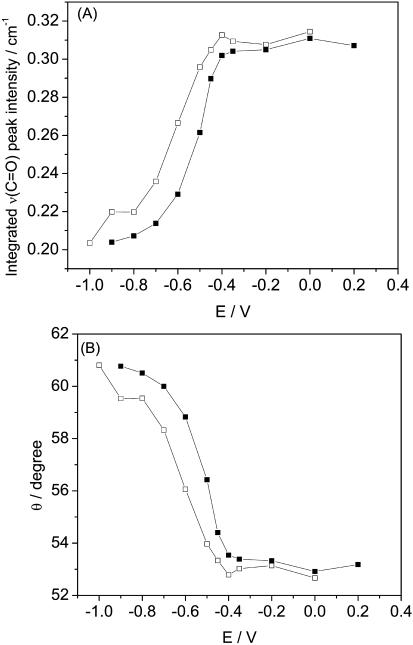
Fig. 5 A shows that the integrated intensity of the v(C=O) increases by ∼60%, on moving from negative to positive potentials. Such a large increase in the intensity cannot be explained by changes in hydration of the ester group. In fact, integrated intensities of the C=O stretch measured for the aqueous suspensions of vesicles equals to 0.256 cm−1 and for the solution of DOPC in CCl4 to 0.237 cm−1, and they differ by only 8%. This behavior indicates that the observed changes of the integrated band intensity display chiefly the potential-driven reorientation of DOPC molecules.
FIGURE 5.
Dependence of (A) integrated ν(C=O) stretch peak intensity and (B) angle (θ) between the direction of transition dipole moment of ν(C=O) and the electric field on potential in a DOPC bilayer on an Au(111) electrode in 0.1 M NaF/D2O solution; (filled squares) positive, (open squares) negative potential step.
Assuming that the absolute value of the transition dipole moment for DOPC molecules in the bilayer deposited onto the gold electrode surface is potential independent and equal to the value of the transition dipole in the suspension of DOPC vesicles, the potential-induced changes in the direction of the transition dipole of the C=O stretch can be calculated using Eq. 6. The transition dipole of the carbonyl stretch is parallel to the C=O bond direction (Fringeli, 1977). Fig. 3 shows that this direction is normal to the initial fragments of the β- and γ-acyl chains. Hence, the angle between the transition dipole and the surface normal is a measure of the average orientation of the ester group. Fig. 5 B plots the mean tilt angle of the C=O group as a function of the electrode potential. At negative E, where the bilayer is detached from the electrode surface, the tilt angle is equal to 61° ± 3°. The uncertainty 3° corresponds to the spread of the tilt angles measured in three independent experiments. This number is comparable to the tilt of ∼65° determined for the C=O stretch in hydrated lamellar multilayers of DOPC by Holmgren et al. (1987) and Hubner and Mantsch (1991). On moving to positive potentials where the bilayer is adsorbed at the metal surface, the tilt angle decreases to ∼53°. This behavior suggests that the glycerol fragments of the β- and γ-chains are more tilted with respect to the surface normal at positive potentials.
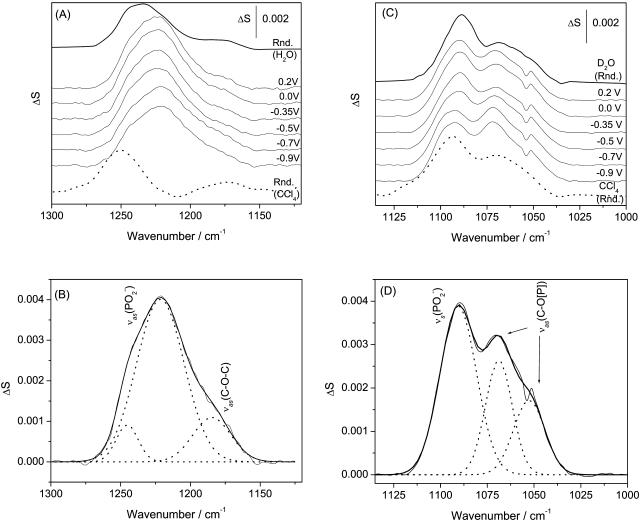
Phosphate group. Fig. 6 A shows IR bands in the 1300–1150 cm−1 spectral region determined for a DOPC bilayer supported at the Au(111) surface at selected electrode potentials. The top and the bottom traces in Fig. 6 A show the transmission spectra for the suspension of DOPC in H2O (suspension of unilamellar vesicles) and a solution of DOPC in CCl4, respectively. This spectral region consists of several overlapping bands whose deconvolution is shown in Fig. 6 B. The band corresponding to the asymmetric stretch of the nonesterified fragment of the phosphate group ((vas(PO2−)) is observed at frequencies of 1250–1220 cm−1. The shape and position of the vas(PO2−) band is strongly solvent dependent. In CCl4, the band maximum is observed at 1248 cm−1, whereas in the aqueous suspension of vesicles it is shifted to ∼1230 cm−1. Hydration of the PO2− group leads to elongation of the P=O bond and to a red shift of the band position. The exact shift depends on the strength of the hydrogen bond (Shimanouchi et al., 1964; Fookson and Wallach, 1978; Akutsu et al., 1981; Goni and Arrondo, 1986; Wong and Mantsch, 1988). In vesicles, water has easier access to the phosphate group in the outer, less compact, leaflet than in the more compact inner leaflet of the bilayer, leading to a splitting of the vas(PO2−) band. Therefore, the vas(PO2−) band can be deconvoluted into two bands with maxima at 1226 and 1243 cm−1, assigned to the weakly and strongly hydrogen-bonded PO2− group in the bilayer (Hubner and Blume, 1998). The small band at 1180 cm−1 in the deconvoluted spectrum shown in Fig. 6 B corresponds to the asymmetric C-O-C stretch of the ester groups in the β- and γ-acyl chains. It will be discussed in the next section.
FIGURE 6.
PM-FTIRRA spectra in the phosphate stretch region of the DOPC bilayer on an Au(111) electrode at the potentials indicated on the figure. (A)  region, solvent 0.1 M NaF/H2O, and (C)
  region, solvent 0.1 M NaF/D2O. Thick lines—spectra calculated for a 4.5 nm thick DOPC bilayer in different environments: (A) (solid lines) H2O, (dashed line) CCl4; (C) (solid lines) D2O, (dashed line) CCl4. (B and D) Deconvolution of the spectra in (B)
  and (D)
  regions.
In the spectrum of the DOPC bilayer supported at the Au(111) electrode, the vas(PO2−) band has its maximum at 1223.0 ± 1 cm−1. It is narrower than the vas(PO2−) band in the transmission spectrum of the aqueous suspension of vesicles. The position and the width of the vas(PO2−) band are similar to the stronger hydrogen-bonded component of the composite vas(PO2−) stretch in the suspension of DOPC vesicles. The deconvolution of the vas(PO2−) band gives two peaks with absorption maxima at 1221.5 and 1244.1 cm−1 (see Fig. 6 C). The ratio of the integrated intensities of the strongly to the weakly hydrogen-bonded bands is approximately equal to 8, and within the error of the deconvolution procedure, is independent of the applied potential. Clearly, in the bilayer supported at the Au(111) electrode surface, the strongly hydrogen-bonded component predominates. At all potentials, the PO2− group is more hydrated in the bilayer supported at the gold surface than in the aqueous suspension of vesicles.
Fig. 6 C shows the 1150–1000 cm−1 spectral region that contains the overlapping symmetric phosphate group stretch vs(PO2−) at ∼1090 cm−1 and asymmetric single bond C-O stretch of the ester phosphate group v(C-O[P]) at ∼1070 cm−1, which is coupled with a single PO vibration (Shimanouchi et al., 1964; Fringeli, 1977; Fringeli and Gunthard, 1981). The deconvolution of these bands is shown in Fig. 6 D. The symmetric stretch of the phosphate group vs(PO2−) is located at 1090.0 cm−1 in the aqueous dispersion of vesicles and at 1095.6 cm−1 in the CCl4 solution of DOPC. In the bilayer supported at the Au(111) electrode, the maximum of the vs(PO2−) band shifts from 1092.3 to 1089.2 cm−1 when the potential changes from −1.0 to 0.0 V (Ag/AgCl). Simultaneously the halfwidth of the band increases from 16.5 to 19.3 cm−1. These changes indicate that the phosphate group is more hydrated in the bilayer adsorbed on the electrode surface (at |σM| < 10 μC cm−2).
Fig. 6 D shows that the asymmetric single bond C-O stretch of the ester phosphate group v(C-O[P]) may be deconvoluted into two bands. For the suspension of DOPC vesicles in D2O, the deconvoluted bands have maxima at 1051 cm−1 and 1066 cm−1. In the CCl4 solution of DOPC, these peaks are located at 1055 cm−1 and 1069 cm−1. For the bilayer supported at the electrode surface, the position of the two deconvoluted bands depends slightly on the electrode potential. The maximum of the lower frequency band changes from 1050 to 1052.6 cm−1 and the higher frequency band from 1070.8 to 1068.2 cm−1 by changing E from −1.0 to 0.2 V (Ag/AgCl). The lower frequency peak corresponds to the C-O stretch of the phosphate ester group bonded to the choline moiety and the higher frequency peak corresponds to the ester phosphate group attached to the glycerol moiety (Fringeli and Gunthard, 1981).
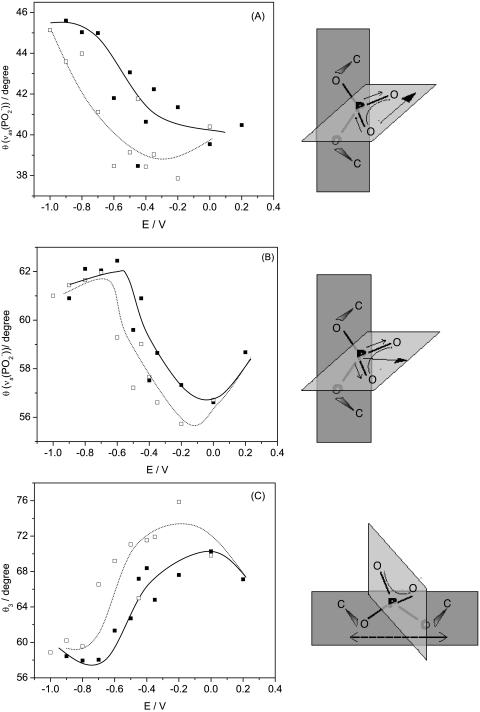
Assuming that the absolute values of the transition dipole of the phosphate group bands for the supported bilayer and for the suspension of vesicles are approximately equal, the angle between the direction of the transition dipole and the surface normal can be calculated using Eq. 6. Fig. 7 A plots the angle between the direction of the transition dipole of the asymmetric stretch and the surface normal (θas) as a function of the electrode potential. For the symmetric stretch, the angle of the transition dipole (θs) is plotted against the electrode potential in Fig. 7 B. The cartoons show that the direction of the transition dipole of the vas(PO2−) band is parallel to the line joining the two nonesterified oxygen atoms of the phosphate group and the transition dipole of the vs(PO2−) stretch is oriented along the bisector of the PO2− group (Shimanouchi et al., 1964; Fringeli, 1977).
FIGURE 7.
Dependence of the angle (θ) between the direction of the transition dipole moment and electric field on potential in the DOPC bilayer on the Au(111) electrode in 0.1 M NaF/H2O solution for (A)  , (B)
, (B)  and (C) the plane of the esterified phosphate group;(filled squares) positive, (open squares) negative potential step.
The angle θs changes from ∼62° to ∼56°, by moving from negative to positive potentials. For the asymmetric phosphate stretch band, the angle θas changes from 46° to 40° in this region of potentials. The values of θas can be compared with the data reported in the literature. For oriented hydrated multilayers of DOPC, the angle between the direction of the transition dipole of the vas(PO2−) band and the normal to the membrane was found to be 69° (Holmgren et al., 1987). A comparable value of 64° was determined for hydrated multilayers of DMPC by (Ter-Minassian-Saraga et al., 1988). Clearly, the phosphate group has a different orientation in the bilayer supported at the Au(111) electrode surface than in hydrated multilayers of phospholipids.
The transition dipoles of the symmetric and asymmetric stretches are located in the plane of the nonesterified group and are perpendicular to each other. They are also perpendicular to the axis joining the two esterified oxygen atoms of the phosphate group (Fig. 3). Denoting the angle between this axis and the surface normal as θ3, one can use geometrical arguments to show that (Umemura et al., 1990):
 |
(7) |
The values of θ3 calculated with Eq. 7 are plotted in Fig. 7 C. The angle changes between ∼58° at negative potentials to ∼75° at potentials where the bilayer is adsorbed at the metal surface.
The data presented in Fig. 7 provide quite detailed information concerning the orientation of the phosphate group. At E > −0.4 V where the bilayer is adsorbed at the electrode surface, the line joining two esterified oxygen atoms of the phosphate group is tilted at a small angle (15°) with respect to the electrode surface. At E < −0.4 V, the tilt of this line increases, and at the most negative potentials (σM < −25 μC cm−2), it becomes close to 30°.
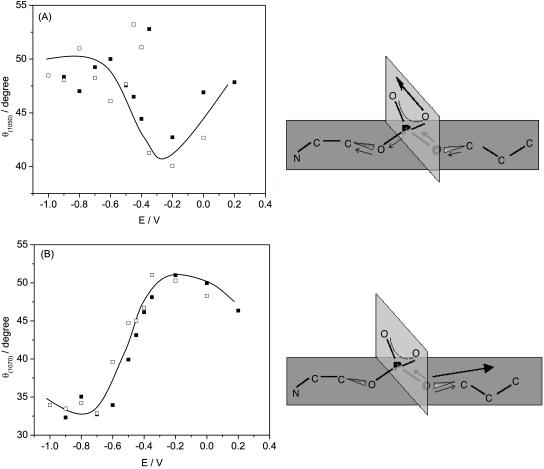
Fig. 8, A and B, plot the angles between the directions of the transition dipoles and the surface normal for the v(C-O[P]) of the group bonded to the choline and the glycerol moieties, respectively. The transition dipole of the ester group bonded to the glycerol moiety changes from 32° to 52° with respect to the normal by moving from negative to positive potentials. To our knowledge, the directions of the transition dipole moments for the C-O[P] stretches with respect to the coordinates of the DOPC molecule were not defined. Therefore we have performed ab initio quantum chemical calculations to find the directions of these transition dipoles.
FIGURE 8.
Dependence of the angle (θ) between the transition dipole moment and the electric field vector for the DOPC bilayer on Au(111) electrode in 0.1 M NaF/D2O for the (C-O[P]) stretches peaks at (A) 1050 cm−1 and (B) 1070 cm−1; (filled squares) positive, (open squares) negative potential step.
The energy optimized structure of an isolated DOPC molecule and its IR vibrational frequencies were predicted. The ab initio (HF/3-21G*) harmonic IR frequencies are well known to be higher by 10% compared to experimental data. They agree in general with data reported in the literature (Hadzi et al., 1992) for a small model compound. Table 1 summarizes the computed, scaled, and experimental data for the phosphate stretch region. The vas(PO2−) is predicted to lie at higher frequency than observed. This is probably the result of the strong hydration of the phosphate group in the experimental system, which was not taken into account in the calculation. Together with the frequencies, the directions of the transition dipole moments were computed and examined. The directions of the transition dipole moments of the C-O ester phosphate groups for the IR band at 1061.9 cm−1 (C-O[P] stretch in the ester group bonded to choline) and 1075.2 cm−1 (C-O[P] stretch in the ester group bonded to the glycerol moiety) are shown in the cartoons attached to Fig. 8, A and B.
TABLE 1.
The predicted vibrational frequencies of the DOPC molecule in the phosphate stretch region
| No. | Predicted vibrational frequency/cm−1 | Scaled vibrational frequency/cm−1 | Experimentally observed vibrational frequency/cm−1 | IR intensity/103 m/mol−1 | Description |
|---|---|---|---|---|---|
| 1 | 1157.9 | 1051.4 | Not observed | 98.3 | C-O[P] symmetric stretch. |
| 2 | 1179.9 | 1061.9 | 1052.6 | 138.0 | C-O[P] asymmetric stretch, where involvement in the stretch in choline part is higher. Transition dipole moment lies in the plane parallel to the PO2− group. |
| 3 | 1195.2 | 1075.7 | 1068.2 | 223.7 | Asymmetric C-O[P] stretch, where P-O-C-C group in the glycerol part is mostly involved; transition dipole moment lies along the C-O bond. |
| 4 | 1209.4 | 1088.5 | 1089.2 | 260.5 | Symmetric PO2− stretch; transition dipole moment lies along the PO2− bisector. |
| 5 | 1359.0 | 1223.0 | 1185.4 | 379.0 | C-O stretch in the glycerol moiety. |
| 6 | 1456.8 | 1311.1 | 1223.0 | 224.5 | Asymmetric stretch of the PO2− group; transition dipole moment lies in the plane of the nonesterified group. |
The vas(C-O[P]) stretch of the phosphate ester group located at 1061.9 cm−1 is a complex vibration that is dominated by the motions of both the C-O ester phosphate groups that are coupled with PO stretches and C-C stretches in the choline group of the DOPC molecule. A movie displaying movement of atoms corresponding to this vibration and the direction of the transition dipole could be seen in the online supplement. Its transition dipole lies in the plane of the PO2− group along the line joining the two nonesterified oxygen atoms of the O-P-O moiety, like the vas(PO2−) stretch. Indeed, a comparison of Figs. 7 A and 8 A shows that the angles between the direction of the transition dipoles of the vas(PO2−) and vas(C-O[P]) bands have comparable magnitude. They also display a similar dependence on the electrode potential. Larger scatter of the experimental points in Fig. 8 A suggests that these data are affected by a larger error in the deconvolution/background correction procedures.
The peak at 1075.7 cm−1 originates from the C-O stretch in the phosphate ester group attached to the glycerol moiety. This vibration is coupled to the PO stretch and C-O stretch in glycerol part of the lipid molecule. A movie showing movements of atoms involved in this complex vibration and the direction of its transition dipole may be seen in the online supplement. Fig. 8 B shows that its transition dipole moment is directed along the C-O bond of the P-O-C line. The transition dipole moment lies along the direction of the C-O bond in the (P-O-C) line of the phosphate ester group joined with the glycerol moiety. The difference between the tilt of this transition dipole moment (θ(1070)) and the line of the phosphate esterified group (θ3) is equal to ∼20°, independent of the electrode potential. This behavior suggests that the phosphoglycerol fragment is quite rigid and that the potential-induced changes of the tilt angle involve a rotation of the whole fragment. Clearly, the definition of the directions of the transition dipole moments of ν(C-O[P]) bands allowed a more precise description of the headgroup conformation in the DOPC bilayers spread on the Au(111) electrode surface.
Glycerol ester group. The asymmetric C-O-C stretch of the ester groups in the β- and γ-acyl chains appears at a frequency of ∼1180 cm−1. The frequency of the C-O-C stretch depends on the conformation of the C-C(O)-O-C moiety. If the glycerol moiety is planar, the band has maximum at 1180 cm−1. Deviation from the planar conformation causes a shift of the band maximum to 1160 cm−1 (Fringeli, 1977, Fringeli and Gunthard, 1981). The C-O-C stretch could be seen as a small but symmetric band with a maximum at 1180 cm−1 in the deconvoluted spectrum of the ∼1200 cm−1 region in Fig. 6 B. This behavior suggests that the glycerol moiety is planar.
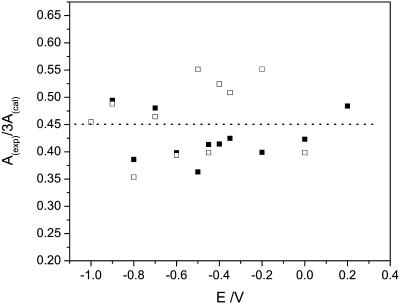
Fig. 9 plots  calculated for the C-O-C stretch band as a function of the electrode potential. The band is weak, hence the scatter of the experimental points is large. Nevertheless the data show that the band intensity is independent of the electrode potential. The transition dipole of the C-O-C stretch is directed along the axis joining the two carbon atoms. The directions of the transition dipoles of the ester groups of the β- and γ-acyl chains form an angle of ∼90° (Hauser et al., 1981). Therefore, the integrated intensity of this band has two components corresponding to the vibrations of the ester groups in the β- and γ-acyl chains. In this case
  is equal to the average cos2θ for the two ester groups:
 |
(8) |
where θβ and θγ are the angles between the directions of the transition dipoles of the ester groups in the β- and γ-acyl chains and the surface normal. Since θβ = 90 − θγ, the following relation applies:
 |
(9) |
Consistently, the ratio  should be equal to 0.5 independent of the applied potential. The median of the experimental data shown in Fig. 9 is 0.45. The agreement between the expected and the experimental values is good and shows that the data analysis procedure is trustworthy.
FIGURE 9.
Dependence of the angle (θ) between the transition dipole moment and the electric field vector for the DOPC bilayer on an Au(111) electrode in 0.1 M NaF/H2O for the (C-O-C) stretches peak of the ester group; (filled squares) positive, (open squares) negative potential scan.
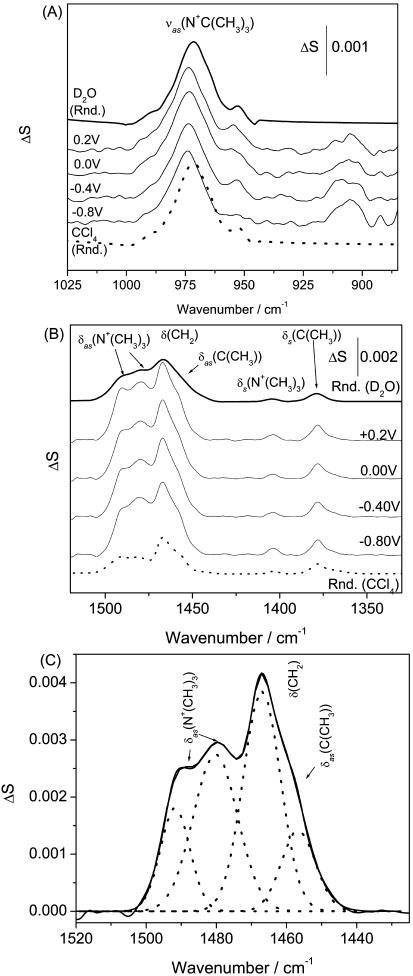
Choline moiety. Fig. 10 A shows bands in the region of the asymmetric and the symmetric stretch of the choline group. In the bilayer, supported at the gold electrode surface, the asymmetric stretch of the choline group vas(CN+(CH3)3) is located at 973.5 ± 0.3 cm−1, independent of the electrode potential. In the spectrum for the dispersion of vesicles in D2O, the vas(CN+(CH3)3) has its maximum at 971.5 cm−1 and in the CCl4 solution of DOPC this band is observed at 970.2 cm−1. Clearly, the band position depends very weakly on the solvent.
FIGURE 10.
PM-FTIRRA spectra in the (A) CN stretching  region and (B) CH bending modes region of a DOPC bilayer on an Au(111) electrode in 0.1 M NaF/D2O solution at different potentials marked on the figure. Thick lines—calculated spectra (solid lines) from D2O DOPC vesicles dispersion and (dashed lines) CCl4 solution for 4.5 nm thick film. (C) Example of a deconvoluted spectrum of the overlapping δas(N+(CH3)3), δ(CH2), and δas(C(CH3)) modes at E = −0.5 V.
The frequency of the symmetric stretch vs(CN+(CH3)3) is strongly dependent on the conformation of the O-C-C-N frame. When the frame has a gauche conformation, the vs(CN+(CH3)3) band splits into a doublet with maxima at 875 cm−1 and ∼910 cm−1. In the trans conformation of the O-C-C-N frame, the vs(CN+(CH3)3)−1 is seen as a single band at ∼930 cm−1 (Fringeli, 1977, Fringeli and Gunthard, 1981). The cutoff frequency of the BaF2 window used in our IR cell is ∼890 cm−1 and is above the position of the second lower frequency vs(CN+(CH3)3) band of the gauche conformation. However, the spectra in Fig. 10 A show no peak at 930 cm−1 and a small band at 906 cm−1. This behavior suggests that the O-C-C-N frame assumes the gauche conformation in the bilayer supported at the Au(111) surface. A similar conformation for the O-C-C-N fragment has been observed in oriented multilayers of phospholipids (Fringeli, 1977).
Information concerning the choline moiety can also be extracted from the N-(CH3)3 bending vibrations located in the busy 1500–1350 cm−1 region, shown in Fig. 10 B. The asymmetric bending modes of methyl groups attached to the nitrogen atom in the choline group appear at 1491 ± 0.5 and 1480 ± 0.5 cm−1 and the symmetric mode at 1404 ± 0.5 cm−1 in all spectra, independent of the applied potential and the nature of the solvent. This behavior is consistent with studies of oriented multilayers of phospholipids (Fringeli, 1977). The independence of the position of the stretching and the bending bands of the choline group on the applied potential and a weak dependence on the nature of the solvent indicate that the choline moiety is not hydrogen bonded to water. This observation is consistent with the data reported in literature (Wong and Mantsch, 1988).
For the purpose of further analysis, the 1510–1420 cm−1 spectral region was deconvoluted using four Gaussian functions as shown in Fig. 10 C. Herein, we will restrict discussion to the δas N+(CH3)3 bands at ∼1490 and ∼1480 cm−1. The methylene at ∼1467 and the methyl bending at ∼1457 cm−1 bands will be described later. The full width at half-maximum (FWHM) of the deconvoluted ∼1490 cm−1 band amounts to 12 ± 1 cm−1 in the spectrum of the aqueous suspension of vesicles or in the spectrum of the CCl4 solution of DOPC. In the bilayer supported at the Au(111) electrode, this band is narrower and its FWHM amounts to 8.0 ± 0.5 cm−1 at all potentials. The FWHM of the 1480 cm−1 bands in the two transmission spectra equals 15 ± 1 cm−1. For the bilayer supported at the gold electrode, the width of the 1480 cm−1 band depends on the electrode potential. For E < −0.6 V (Ag/AgCl) the FWHM equals 15.2 ± 0.5 cm−1 and is comparable with the FWHM in the spectrum of the suspension of vesicles. When E > −0.4 V (Ag/AgCl), the width of this band decreases to 12.0 ± 0.5 cm−1. Such band narrowing may indicate a restricted mobility of the choline group in the bilayer adsorbed at the electrode surface.
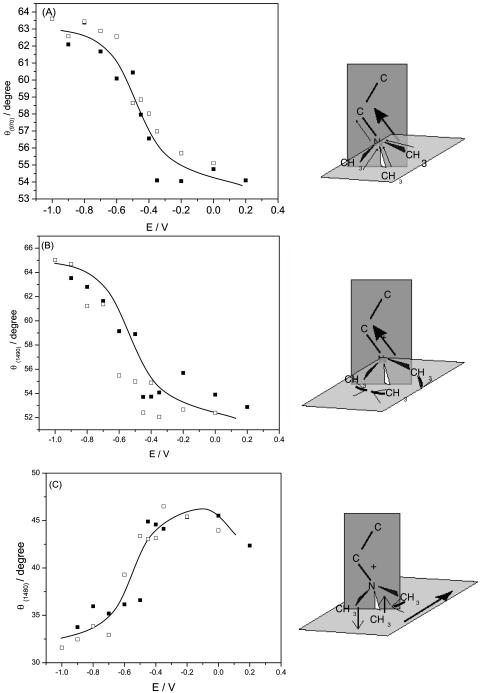
The transition dipole moments of the vas(CN+(CH3)3) band at ∼970 cm−1 and the δas(CN+(CH3)3) band at 1490 cm−1 are directed parallel to the C3v axis and thus are parallel to the CN bond (Fig. 3). The transition dipole of the second δas(CN+(CH3)3) band at ∼1480 cm−1 is located in the plane of the three methyl groups at a 90° angle with respect to the C3 axis (Fringeli and Gunthard, 1981; Fringeli, 1977). The integrated intensities of these bands were used to calculate the directions of the transition dipoles with respect to the surface normal. The angles between the directions of the transition dipoles of the ∼970 cm−1, ∼1490 cm−1, and ∼1480 cm−1 bands are plotted against the electrode potential in Fig. 11, A–C. The cartoons show the directions of the transition dipoles.
FIGURE 11.
(A) Dependence of the angle (θ) between the transition dipole moment and the electric field vector for the  on the electrode potential in the DOPC bilayer on Au(111) in 0.1 M NaF/D2O; (B) δas(N+(CH3)3) peak at 1490 cm−1 and (C) peak 1480 cm−1, (filled squares) positive, (open squares) negative potential steps.
In agreement with the above assignment, the angles of the transition dipoles of the νas(CN+(CH3)3) and δas(CN+(CH3)3) bands are of comparable magnitude and display a similar dependence on the electrode potential. Clearly, consistent information can be extracted from the analysis of different bands in the spectra indicating that the data and their analysis are free of major errors. The angles of the transition dipoles of the ∼1490 cm−1 and ∼1480 cm−1 bands vary with potential in opposite directions. Further, since the two transition dipoles are orthogonal, the angles between directions of these transition dipoles and the surface normal should sum up to 90°. Indeed, at a given potential, the sum of the angles reported in Fig. 11, B and C, is equal to 95 ± 5°. The agreement between the expected and the observed behavior confirms the validity of the procedure used in these calculations.
The angle between the transition dipole and the surface normal of the 970 cm−1 and 1490 cm−1 band shows the orientation of the C3 axis of the choline group. At negative potentials, the axis is tilted with respect to the normal at ∼64° (970 cm−1) to ∼65° (1490 cm−1). The tilt angle decreases by ∼10° to a value of ∼53° at E = 0.2 V. It is useful to compare these data with the orientation of the C3 axis of the choline group in planar multilayers of phospholipids, reported in the literature. In dry films, the C3 axis is tilted at ∼64−61° and in the hydrated films at ∼56−51° with respect to the bilayer normal (Fringeli, 1977; Ter-Minassian-Saraga et al., 1988; Hubner and Mantsch, 1991). In the bilayer supported at the Au(111) electrode surface, at negative potentials (when σM < −10 μC cm−2) the choline group has a similar orientation with respect to the normal as in a dry film of phospholipids and at positive potentials (when σM < −10 μC cm−2) it is oriented as in hydrated films. Incidentally, the analysis of the behavior of the phosphate and carbonyl groups presented earlier indicated that the headgroup region of DOPC is more hydrated at E > −0.4 V and less hydrated at E < −0.4 V. Evidently, various spectral features provide consistent information concerning the behavior of the DOPC molecules at the gold electrode surface.
The hydrocarbon chains
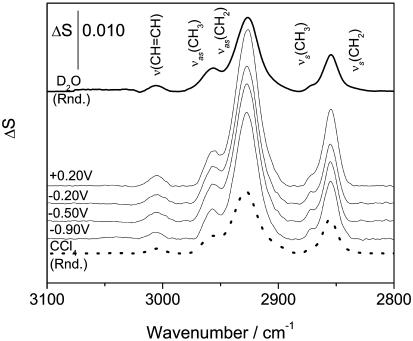
The analysis of bending and stretching CH modes in the IR spectrum provides information concerning the orientation and conformation of the acyl chains of the DOPC molecule. The bending vibrations of the methyl and methylene groups overlap with the bands of the choline group and their analysis requires a de-convolution described earlier and shown in Fig. 10 B. The CH stretching region of the IR spectrum of the DOPC bilayer supported at the gold electrode surface is shown in Fig. 12. The band assignment is taken from Fringeli (1977). In the spectrum of the bilayer supported at the Au(111) electrode, the frequencies of the CH stretching bands are potential-independent and equal to the frequencies of the corresponding bands in the transmission spectrum for the dispersion of vesicles or in the solution of DOPC in CCl4. We will discuss the behavior of the HC=CH, CH2, and CH3 vibrations separately.
FIGURE 12.
PM-FTIRRA spectra in the CH stretching region of a DOPC bilayer on a Au(111) electrode in 0.1 M NaF/D2O solution at potentials indicated on the figure. Thick line spectra calculated for 4.5 nm thick DOPC in D2O (solid line) and CCl4 (dotted line).
CH2 group. The asymmetric νas(CH2) and the symmetric νs(CH2) stretches of the methylene group appear at 2927.6 ± 0.2 cm−1 and 2854.7 ± 0.4 cm−1(Fig. 12). The halfwidths of the νas(CH2) and νs(CH2) bands in the bilayer supported at the gold electrode surface are equal to 19.7 ± 0.4 cm−1 and 12.1 ± 0.3 cm−1, respectively. The halfwidths of νas(CH2) and νs(CH2) in the aqueous dispersion of DOPC vesicles are equal to 21.5 cm−1 and 13.5 cm−1 and in the CCl4 solution to 20.1 and 13.3 cm−1. The halfwidths of the asymmetric and the symmetric methylene stretches indicate high mobility of the acyl chains in all investigated environments, and the positions of the peaks are characteristic of a liquid bilayer in which the saturated segments of the acyl chains are disordered by the presence of gauche conformations (Snyder et al., 1978; Cameron et al., 1980; Casal and Mantsch, 1984; Naselli et al., 1985).
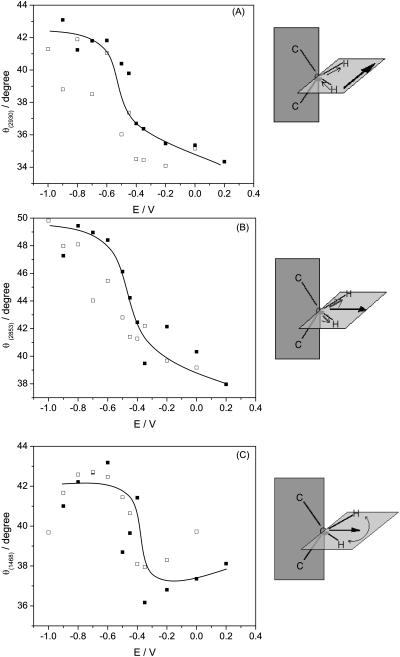
Fig. 12 shows that the intensity of the CH2 stretch changes with the electrode potential. Apparently, the orientation of the chains is influenced by the potential. The transition dipole moments of methylene groups are located in the plane of the CH2 moiety. If the acyl chain had an all trans conformation, the transition dipoles would be normal to the chain and their directions may be used to determine the tilt angle of the chain. However, in the liquid state the chains are bent due to gauche conformations and the angles between the transition dipoles and the surface normal are only a rough measure of the order of the acyl chains. Figs. 13, A and B, plot the angle between the transition dipole moment of the symmetric and the asymmetric stretches and the surface normal as a function of the applied potential. In addition, Fig. 13 C plots the angle for the transition dipole of the scissoring CH2 vibration (δ(CH2)) observed earlier at 1467.2 cm−1. The cartoons show the directions of the transition dipoles. Transition dipoles of the δ(CH2) and νs(CH2) have the same direction (Fringeli, 1977; Allara and Nuzzo, 1985). Indeed, within the limits of the experimental error of ± 5o, the same angles of the transition dipoles are calculated from the two bands. The tilt angle calculated from the 1468 cm−1 band may be affected by a larger error due to the uncertainty of the deconvolution method.
FIGURE 13.
Dependence of the angle (θ) between transition dipole moment and electric field on potential for (A)  , (B)
, (B)  and (C)
  for a DOPC bilayer spread on an Au(111) electrode, 0.1 M NaF/D2O; (filled squares) positive, (open squares) negative potential step.
At E = −1.0 V, the average angle of the transition dipole of νas(CH2) and νs(CH2) with respect to the normal is equal to ∼43° and ∼50°, respectively. In oriented multilayers of DOPC, the angle of the transition dipole of νs(CH2), calculated from the data reported by Holmgren et al. (1987), is ∼61° and hence is somewhat higher than observed in the present studies. By changing the potential in the positive direction, the angle between the transition dipole of the CH2 stretch bands and the surface normal decreases by ∼10°.
Apparently, changes of the packing of the acyl chains accompany the potential-driven reorientation of the polar heads of DOPC molecules in the bilayer supported at the gold electrode surface. A decrease in the angle between the transition dipole of the CH2 groups and the surface normal on moving to positive potentials has also been observed in a DMPC bilayer supported on an Au(111) electrode (Horswell et al., 2002).
CH3 group. The asymmetric and the symmetric stretches of the methyl group have maxima at frequencies of 2957.5 ± 0.2 and 2870.7 ± 0.4 cm−1, respectively (see Fig. 12). The halfwidth of νas(CH3) in the bilayer is equal to 14.7 ± 0.5 cm−1 and is somewhat less than the halfwidth of the band in the CCl4 solution equal to 16.0 cm−1 or in the suspension of vesicles where it is equal to 18.9 cm−1. The average tilt angle of the terminal methyl group in the bilayer does not depend on potential and is equal to 50 ± 2.5°. The bending bands of the methyl terminal group of the hydrocarbon chains appear at the following frequencies: δs at 1378.1± 0.2 cm−1 and δas at 1456.7 ± 0.2 cm−1(see Fig. 10). The angle between the transition dipoles of the methyl bending bands and the surface normal is equal to 55 ± 2°. The tilt angle for a random orientation is 55°. Therefore, these results suggest that the terminal methyl groups are almost randomly oriented in the bilayer and can freely rotate.
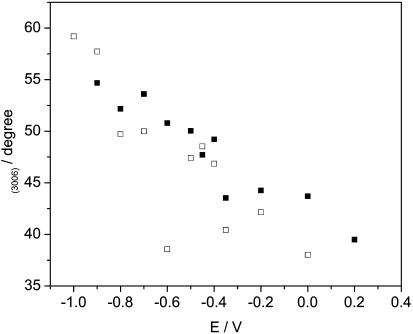
HC=CH group. The maximum of the CH stretch band of the HC=CH group is located at 3006.5 ± 0.4 cm−1(see Fig. 12). The transition dipoles moment of this band is parallel to the direction of the double bond (Fringeli, 1977; Fringeli and Gunthard, 1981). Fig. 14 plots the angle between the direction of the transition dipole and the surface normal, calculated from the integrated intensities of this band. At the most negative potential, E = −1.0 V, the C=C bond is oriented at an ∼55 ± 3° angle with respect to the surface normal. The C=C bonds are therefore oriented randomly. However, the tilt angle decreases with the electrode potential and at E = 0.2 V it becomes equal to ∼40 ± 3°. The tilt of the CH=CH bond in oriented hydrated multilayers of DOPC, calculated from the order parameter reported by Holmgren et al. (1987) is equal to 64°. Apparently, the CH=CH groups are oriented differently in the bilayer supported at the gold electrode than in the hydrated multilayers.
FIGURE 14.
Dependence of the angle (θ) between transition dipole moment of the ν(CH=CH) stretch and electric field on potential for a DOPC bilayer spread on an Au(111) electrode, 0.1 M NaF/D2O; (filled squares) positive, (open squares) negative potential step.
In general, due to the presence of gauche conformations in the acyl chains of the DOPC molecule, the chains are disordered and it is impossible to provide precise information concerning the structure of the hydrocarbon portion of the bilayer. However, the change of the angles in the transition dipole moments of the CH stretching bands suggests that by moving from negative to positive potentials, the chains tilt to assume a smaller angle with respect to the electrode surface, as has been previously observed for DMPC bilayers adsorbed at Au(111) electrodes (Horswell et al., 2002).
SUMMARY AND CONCLUSIONS
We have applied electrochemistry and PM-IRRAS to provide a quantitative, molecular-level description of the field-assisted spreading of DOPC vesicles at a gold electrode surface. Electrochemical measurements demonstrated that vesicles fuse to form a bilayer at the electrode surface when the charge density at the metal is <−8 μC cm−2 and the field is <2 × 10⁸ V m−1. At higher charge densities, the film is detached from the gold surface. Recent neutron reflectivity experiments performed in this laboratory demonstrated that at these high charge densities, the bilayer remains in close proximity to the gold surface, separated from the metal by an ∼1 nm thick layer of the solvent (Burgess et al., 2003).
PM-FTIRRAS measurements provided detailed information concerning changes of hydration, conformation, and orientation that accompany the field-driven transformation of the bilayer membrane. The IR data demonstrated that the carbonyl and phosphate groups are more hydrated in the membrane that is adsorbed at the electrode surface at |σM| < 8 μC cm−2 than when it is detached from the electrode surface at higher charge densities. The results show that a significant amount of water enters the polar head region of the phospholipid molecule when it is in contact with the metal surface. The acyl chains of the DOPC molecules are bent due to the presence of gauche conformations and their exact orientation cannot be determined. Nevertheless, the IR data indicate that the chains assume a larger tilt angle with respect to the surface normal when the membrane is deposited onto the metal surface. This result is consistent with recent neutron reflectivity experiments that demonstrated that a thinner bilayer of phospholipids is formed at a gold electrode surface at low charge densities (Burgess et al., 2003) and with PM-FTIRRAS data reported for a DMPC bilayer at an Au(111) electrode (Horswell et al., 2002).
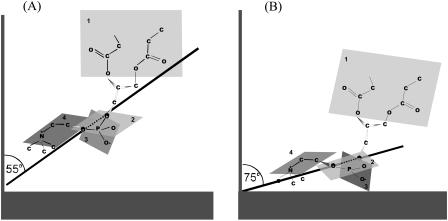
The IR data provided detailed information concerning the field-driven reorientation of the polar head region of the DOPC molecules. The orientation of the polar head of a DOPC molecule with respect to the gold surface is schematically shown in Fig. 15 for the two extreme potentials (charge densities). In the bilayer supported at the metal surface, the polar regions of the leaflets turned to the metal and to the solution are exposed to different environments. The orientation of the polar heads in each of the two leaflets may differ. The IR data give average structural information; hence the models in Fig. 15 represent average orientation of the two leaflets in the bilayer and should not be interpreted as showing only the polar head region in the leaflet turned to the metal.
FIGURE 15.
Scheme of orientation of the polar headgroup of DOPC molecule in the bilayer at (A) E = −1.0 V and (B) E = 0.2 V.
The ester groups of β- and γ-chains are placed in plane 1. The hydrocarbon chains are disordered and hence they are omitted. The line drawn through the two esterified oxygen atoms of the phosphate group shows the tilt of the phosphocholine moiety. Plane 2 shows the position of the two esterified and one nonesterified oxygen atoms of the phosphate group. The two nonesterified oxygen atoms of the phosphate group are located in plane 3, which is normal to the base of the phosphate group pyramid. Finally, the O-C-C-N frame of the choline moiety (gauche conformation) is located in plane 4.
Fig. 15 shows that the angle between plane 2 and the surface normal increases by ∼20° with respect to the surface normal on moving from negative to positive potentials. This change brings the phosphate group closer to the bilayer surface. The position of all other planes is affected by this change. The angle between plane 1 and the normal to the surface increases. At the same time, planes 3 and 4 assume a smaller angle with the surface normal. To account for an ∼10° decrease of the angle between the directions of the C=O bond of the ester group and C-N bond in the choline moiety and the surface normal, planes 1 and 4 have to rotate somewhat as indicated in the figure. It is useful to note that the orientation observed at zero charge density corresponds to a larger area per molecule than the orientation observed at the negative charge densities. Therefore, the chains are expected to be more tilted with respect to the surface normal at the positive potentials and small charge densities (Tristram-Nagel et al., 1993), consistent with the IR data.
We have demonstrated the tremendous power of a combined electrochemistry-PM-IRRAS investigation of model biological membranes supported at a metal electrode surface. By depositing a bilayer onto an electrode surface, one can easily apply a static electric field comparable in magnitude with the field acting in a natural membrane. Electrochemical methods allow us to measure and to vary this field continuously. The IR reflection absorption spectroscopy provides unique molecular level information concerning the field-driven changes in the hydration, orientation, and conformation of the phospholipid molecules in the membrane.
SUPPLEMENTARY MATERIAL
An online supplement to this article can be found by visiting BJ Online at http://www.biophysj.org.
Supplementary Material
Acknowledgments
J.L. acknowledges the Canada Foundation for Innovation for a Canada Research Chair Award, I.Z. acknowledges a North Atlantic Treaty Organization postdoctoral fellowship, and A.L. acknowledges Alexander von Humboldt Stiftung for the Feodor Lynen Fellowship.
This work was supported by a grant from the Natural Sciences and Engineering Research Council of Canada.
References
- Abrahamson S., and I. Ryestedt-Nahringhauer. 1962. The crystal structure of the low-melting form of oleic acid. Acta Cryst. 15:1261–1268. [Google Scholar]
- Allara, D. L., and R. G. Nuzzo. 1985. Spontaneously organized molecular assemblies. 2. Quantitative infrared spectroscopic determination of equilibrium structures of solution-adsorbed n-alkanoic acids on an oxidized aluminum surface. Langmuir. 1:52–66. [Google Scholar]
- Allara, D. L.; and J. D. Swalen. 1982. An infrared reflection spectroscopy study of oriented cadmium arachidate monolayer films on evaporated silver. J. Phys. Chem. 86:2700–2704. [Google Scholar]
- Akutsu, H., M. Ikematsu, and Y. Kyogoku. 1981. Molecular structure and interaction of dipalmitoyl phosphatidylcholine in multilayers. Comparative study with phosphatidylethanolamine. Chem. Phys. Lipids. 28:149–158. [Google Scholar]
- Azzone, G. F., D. Pieterbon, and M. Zoratti. 1984. Determination of the proton electrochemical gradient across biological membranes. In Current Topics in Bioenergetics, Vol. 13. C. P. Lee, editor. Academic Press, New York. 1–77.
- Barenholz, Y., D. Gibbes, B. J. Litman, J. Goll, T. E. Thompson, and R. D. Carlson. 1977. A simple method for the preparation of homogeneous phospholipid vesicles. Biochemistry. 16:2806–2810. [DOI] [PubMed] [Google Scholar]
- Barner, B. J., M. J. Green, E. I. Saez, and R. M. Corn. 1991. Polarization modulation Fourier transform infrared reflectance measurements of thin films and monolayers at metal surfaces utilizing real-time sampling electronics. Anal. Chem. 63:55–60. [Google Scholar]
- Becucci, L., R. Guidelli, Q. Y. Lin, R. J. Bushby, and S. D. Evans. 2002. A biomimetic membrane consisting of a polyethyleneoxythiol monolayer anchored to mercury with a phospholipid bilayer on top. J. Phys. Chem. 106:10410–10416. [Google Scholar]
- Bertie, J. E., M. K. Ahmed, and H. H. Eysel. 1989. Infrared intensities of liquids. 5. Optical and dielectric constants, integrated intensities, and dipole moment derivatives of H2O and D2O at 22°C. J. Phys. Chem. 93:2210–2218. [Google Scholar]
- Bizzotto, D., and A. Nelson. 1998. Continuing electrochemical studies of phospholipid monolayers of dioleoyl phosphatidylcholine at the mercury-electrolyte interface. Langmuir. 14:6269–6273. [Google Scholar]
- Bizzotto, D., V. Zamlynny, I. Burgess, C. A. Jeffrey, H. Q. Li, J. Rubinstein, Z. Galus, A. Nelson, B. Pettinger, A. R. Merill, and J. Lipkowski. 1999. Amphiphilic and ionic surfactants at electrode surfaces. In Interfacial Electrochemistry: Theory, Experiment, and Applications. A. Wieckowski, editor. Marcel Dekker, New York. 405–426.
- Blume, A., W. Hubner, and G. Messer. 1988. Fourier transform infrared spectroscopy of 13C=O-labeled phospholipids hydrogen bonding to carbonyl groups. Biochemistry. 27:8239–8249. [DOI] [PubMed] [Google Scholar]
- Buffeteau, T., B. Desbat, D. Blaudez, and J. Turlet. 2000. Calibration procedure to derive IRRAS spectra from PM IRRAS spectra. Appl. Spectrosc. 54:1646–1650. [Google Scholar]
- Buoninsegni, F. T., R. Herrero, and M. R. Moncelli. 1998. Alkanethiol monolayers and alkanethiol phospholipid bilayers supported by mercury: an electrochemical characterization. J. Electroanal. Chem. 452:33–42. [Google Scholar]
- Burgess, I., M. Li, S. L. Horswell, G. Szymanski, J. Lipkowski, J. Majewski, and S. Satija. 2003. Electric field driven transformations of a supported model biological membrane. An electrochemical and neutron reflectivity study. Biophys. J. In press. [DOI] [PMC free article] [PubMed]
- Cameron, D. G., H. L. Casal, and H. H. Mantsch. 1980. Characterization of the pretransition in 1,2-dipalmitoyl-sn-glycero-3-phosphocholine by Fourier transform infrared spectroscopy. Biochemistry. 19:3665–3672. [DOI] [PubMed] [Google Scholar]
- Casal, H. L., and H. H. Mantsch. 1984. Polymorphic phase behavior of phospholipid membranes studied by infrared spectroscopy. Biochim. Biophys. Acta. 779:381–401. [DOI] [PubMed] [Google Scholar]
- Green, M. J., B. J. Barner, and R. M. Corn. 1991. Real time sampling electronics for double modulation experiments with Fourier transform infrared spectrometers. Rev. Sci. Instrum. 62:1426–1430. [Google Scholar]
- Cornell, B. A., V. L. Braach-Maksvytis, L. G. King, P. D. J. Osman, B. Raguse, L. Wieczorek, and R. L. Pace. 1997. A biosensor that uses ion-channel switches. Nature. 387:580–583. [DOI] [PubMed] [Google Scholar]
- Coronado, R. 1986. Recent advances in planar phospholipid bilayer techniques for monitoring ion channels. Ann. Rev. Biophys. Chem. 15:259–277. [DOI] [PubMed] [Google Scholar]
- Corey, D. P. 1983. Patch clamp: current excitement in membrane physiology. Neuroscience Commentaries. 1:99–110. [Google Scholar]
- Damaskin, B. B., O. A. Petrii, and V. V. Batrakov. 1971. Adsorption of Organic Compounds at Electrodes. Plenum Press, New York.
- Dickertmann, D., J. W. Schultze, and F. D. Koppitz. 1976. Electrochim. Acta. 21:967–971. [Google Scholar]
- Dicko, A., H. Bourgue, and M. Pezolet. 1998. Study by infrared spectroscopy of the conformation of dipalmitoylphosphatidylglycerol monolayers at the air-water interface and transferred on solid substrates. Chem. Phys. Lipids. 96:125–139. [Google Scholar]
- Flasch, C. R., A. Gericke, and R. Mendelsohn. 1997. Quantitative determination of molecular chain tilt angles in monolayer films at the air-water interface: infrared reflection absorption spectroscopy of bohenic acid methylester. J. Phys. Chem. B. 101:58–65. [Google Scholar]
- Fookson, J. E., and D. F. H. Wallach. 1978. Structural differences among phosphatidylcholine, phosphatidylethanolamine, and mixed phosphatidylchoilne/phosphatidylethanolamine multilayers: an infrared absorption study. Arch. Biochem. Biophys. 189:195–204. [DOI] [PubMed] [Google Scholar]
- Frey, S., and L. K. Tamm. 1991. Orientation of melithin in phospholipid bilayer. A polarized attenuation total reflection infrared study. Biophys. J. 60:922–930. [DOI] [PMC free article] [PubMed] [Google Scholar]
- Fringeli, U. P. 1977. The structure of lipids and proteins studied by attenuated total reflection (ATR) infrared spectroscopy. Z. Naturforsch. 32C:20–45. [DOI] [PubMed] [Google Scholar]
- Fringeli, U. P., and H. H. Gunthard. 1981. Infrared membrane spectroscopy. Mol. Biol. Biochem. Biophys. 31:270–332. [DOI] [PubMed] [Google Scholar]
- Frisch, M. J. et al. Gaussian98, Rev.A.11, Gaussian Inc., Pittsburgh PA, 2001.
- Green, M. J., B. J. Barner, and R. M. Corn. 1991. Real time sampling electronics for double modulation experiments with Fourier transform infrared spectrometers. Rev. Sci. Instrum. 62:1426–1430. [Google Scholar]
- Goni, F. M., and J. L. R. Arrondo. 1986. A study of phospholipid phosphate groups in model membranes by Fourier transform infrared spectroscopy. Faraday Discuss. 81:117–126. [DOI] [PubMed] [Google Scholar]
- Guidelli, R.; G. Aloisi, L. Becucci, A. Dolfi, M. R. Moncelli, and F. Tadini Bouninsegni. 2001. Bioelectrochemistry at metal-water interfaces. J. Electroanal. Chem. 504:1–28. [Google Scholar]
- Hadzi, D., M. Hodoscek, J. Gradolnik, and F. Avbelj. 1992. Intermolecular effects on phosphate frequencies in phospholipids—infrared study and ab initio model calculations. J. Mol. Struct. 266:8–19. [Google Scholar]
- Hauser, H., I. Pascher, R. H. Pearson, and S. Sundell. 1981. Preferred conformation and molecular packing of phosphatidylethanolamine and phosphatidylcholine. Bochim. Biophys. Acta. 650:21–51. [DOI] [PubMed] [Google Scholar]
- Holmgren, A., L. B. A. Johansson, and G. Lindblom. 1987. An FTIR linear dichroism study of lipid membranes. J. Phys. Chem. 91:5298–5301. [Google Scholar]
- Horswell, S. L., V. Zamlynny, H. Q. Li, A. R. Merrill, and J. Lipkowski. 2002. Electrochemical and PM IRRAS studies of potential controlled transformations of phospholipid layers on Au(111) electrodes. Faraday Discussions. 121:405–422. [DOI] [PubMed] [Google Scholar]
- Hubner, W., and A. Blume. 1998. Interactions at the lipid-water interface. Chem. Phys. Lipids. 96:99–123. [Google Scholar]
- Hubner, W., and H. H. Mantsch. 1991. Orientation of specifically 13C=O labeled phosphatidylcholine multilayers from polarized attenuated total reflection FT-IR spectroscopy. Biophys. J. 59:1261–1272. [DOI] [PMC free article] [PubMed] [Google Scholar]
- Israelachvili, J. 1991. Intermolecular and surface forces. J. Israelachvili, editor. Academic Press, London. 366–394.
- Krysinski, P., A. Zebrowska, A. Michota, J. Bukowska, L. Becucci, and M. R. Moncelli. 2001. Tethered mono- and bilayer lipid membranes on Au and Hg. Langmuir. 17:3852–3857. [Google Scholar]
- Lakey, J. H., and S. L. Slatin. 2001. Pore-forming collicins and their relatives. Curr. Top. Microbiol. Immunol. 257:131–161. [DOI] [PubMed] [Google Scholar]
- Lang, H., C. Duschl, and H. Vogel. 1994. A new class of thiolipids for the attachment of lipid bilayers on gold surfaces. Langmuir. 10:197–210. [Google Scholar]
- Leermakers, F. A. M., and A. Nelson. 1990. Substrate-induced structural changes in electrode-adsorbed lipid layers. J. Electroanal. Chem. 278:53–72. [Google Scholar]
- Leonenko, Z. V., A. Carnini, and D. T. Cramb. 2000. Supported planar bilayer formation by vesicles fusion: the interaction of phospholipid vesicles with surfaces and the effect of gramicidin on bilayer properties using atomic force microscopy. Biochim. Biophys. Acta. 1509:131–147. [DOI] [PubMed] [Google Scholar]
- Levin, I. W., E. Mushayakarara, and R. Bittman. 1982. Vibrational assignment of the sn1 and sn2 carbonyl stretching modes of membrane phospholipids. J. Raman Spectrosc. 13:231–234 [Google Scholar]
- Lewis, R. N., R. N. McElhaney, W. Phole, and H. H. Mantsch. 1994. Components of the carbonyl stretching band in the infrared spectra of hydrated 1,2-diacylglycerolipid bilayers: a reevaluation. Biophys. J. 67:2367–2375. [DOI] [PMC free article] [PubMed] [Google Scholar]
- Le Saux, A., J. M. Ruysschaert, and E. Goormaghtigh. 2001. Membrane molecule reorientation in an electric field recorded by attenuated total reflection Fourier transform infrared spectroscopy. Biophys. J. 80:324–330. [DOI] [PMC free article] [PubMed] [Google Scholar]
- Li, N., V. Zamlynny, J. Lipkowski, F. Henglein, and B. Pettinger. 2002. In situ IR reflectance absorption spectroscopy studies of pyridine adsorption at the Au(110) electrode surface. J. Electroanal. Chem. 524-525:43–53. [Google Scholar]
- Lingler, S., I. Rubinstein, W. Knoll, and A. Offenhausser. 1997. Fusion of small unilamellar lipid vesicles to alkanethiol and thiolipid self-assembled monolayers on gold. Langmuir. 13:7085–7091. [Google Scholar]
- Lipkowski, J., and L. Stolberg. 1992. Molecular adsorption at gold and silver electrodes. In Adsorption of Molecules at Metal Electrodes. J. Lipkowski and P. N. Ross, editors. VCH Publishers, New York. 171–238.
- Lipert, R. J., B. D. Lamp, and M. D. Porter. 1998. Advances in infrared and Raman spectroscopy. In Specular Reflection Spectroscopy. F. M. Mirabella, editor. Wiley and Sons, Chichester, UK. 83–126.
- Mantsch, H. H., and R. N. McElhaney. 1991. Phospholipid phase transitions in model and biological membranes as studied by infrared spectroscopy. Chem. Phys. Lipids. 57:213–226. [DOI] [PubMed] [Google Scholar]
- McLaughlin, S. 1977. Electrostatic potentials at membrane-solution interfaces. Current Topics in Membranes and Transport. 9:71–144. [Google Scholar]
- Miller, I. R. 1981. Structural and energetic aspects of charge transport in lipid layers and in biological membranes. In Topics in Bioelectrochemistry and Bioenergetics. G. Millazzo, editor. Wiley, Chichester, UK. 194.
- Naselli, C., J. F. Rablot, and J. D. Swalen. 1985. Order-disorder transitions in Langmuir-Blodgett monolayers. I. Studies of two-dimensional melting by infrared spectroscopy. J. Chem. Phys. 82:2136–2140. [Google Scholar]
- Naumann, R., S. M. Schiller, F. Giess, B. Grohe, K. B. Hartman, I. Karcher, I. Koper, J. Lubben, K. Vasilev, and W. Knoll. 2003a. Tethered lipid bilayers on ultraflat gold surfaces. Langmuir. 19:5435–5443. [Google Scholar]
- Naumann, R., D. Walz, S. M. Schiller, and W. Knoll. 2003b. Kinetics of valinomycin-mediated K+ transport through tethered bilayer lipid membranes. J. Electroanal. Chem. 550-551:241–252. [Google Scholar]
- Nelson, A., and A. Benton. 1986. Phospholipid monolayers at the mercury-water interface. J. Electroanal. Chem. 202:253–270. [Google Scholar]
- Nelson, A., and D. Bizzotto. 1999. Chronoamperometric study of Tl(I) reduction at gramicidin-modified phospholipids-coated mercury electrodes. Langmuir. 15:7031–7039. [Google Scholar]
- Palik, E. Handbook of Optical Constants of Solids II. E. Palik, editor. Academic Press, San Diego.
- Pignataro, B., C. Steinem, H. J. Galla, H. Fusch, and A. Jonshoff. 2000. Specific adhesion of vesicles monitored by scanning force microscopy and quartz crystal microbalance. Biophys. J. 78:487–498. [DOI] [PMC free article] [PubMed] [Google Scholar]
- Plant, A. L. 1999. Supported hybrid bilayer membranes as rugged cell membrane mimics. Langmuir. 15:5128–5135. [Google Scholar]
- Popenoe, D. D., S. M. Stole, and M. D. Porter. 1992. Optical considerations for infrared spectroscopic stretching region of monolayer films at an aqueous/metal interface. Appl. Spectrosc. 46:79–87. [Google Scholar]
- Raguse, B., V. Braach-Maksvytis, B. A. Cornell, L. G. King, P. D. J. Osman, R. J. Pace, and L. Wieczorek. 1998. Tethered lipid bilayer membranes: formation and ionic reservoir characterization. Langmuir. 14:648–659. [Google Scholar]
- Reviakine, I., and A. Brisson. 2000. Formation of supported phospholipid bilayers from unilamellar vesicles investigated by atomic force microscopy. Langmuir. 16:1806–1815. [Google Scholar]
- Richer, J., and J. Lipkowski. 1985. Measurement of physical adsorption of organic species at solid electrodes. J. Electrochem. Soc. 133:121–128. [Google Scholar]
- Sackmann, E. 1996. Supported membranes: scientific and practical applications. Science. 271:43–48. [DOI] [PubMed] [Google Scholar]
- Scott, A. P., and L. Radom. 1996. Harmonic vibrational frequencies: an evaluation of Hartree-Fock, Moller-Plesset, quadratic configuration interaction, density functional theory, and semiempirical scale factors. J. Phys. Chem. 100:16502–16513. [Google Scholar]
- Shimanouchi, T., M. Tsuboi, and Y. Kyogoku. 1964. Infrared spectra of nucleic acids and related compounds. In Advances in Chemical Physics, Vol. 7. J. Duchesne, editor. Interscience, New York. 435–499.
- Snyder, R. G., S. L. Hsu, and S. Krim. 1978. Vibrational spectra in the CH stretching region and the structure of the polymethylene chain. Spectrochim. Acta. 34A:395–406. [Google Scholar]
- Stauffer, V., R. Stoodly, J. O. Agak, and D. Bizzotto. 2001. Adsorption of DOPC onto Hg from the G/S interface and from a liposomal suspension. J. Electroanal. Chem. 516:73–82. [Google Scholar]
- Stora, T., J. H. Lakey, and H. Vogel. 1999. Ion-channel gating in transmembrane receptor proteins: functional activity in tethered lipid membranes. Angew. Chem. Int. Ed. 38:389–392. [DOI] [PubMed] [Google Scholar]
- Tajima, K., and N. L. Gershfeld. 1985. Phopspholipid surface bilayers at the air-water interface. I. Thermodynamic properties. Biophys. J. 47:203–209. [DOI] [PMC free article] [PubMed] [Google Scholar]
- Ter-Minassian-Saraga, L., E. Okamura, J. Umemura, and T. Takenaka. 1988. Fourier transform-attenuated total reflection spectroscopy of hydration of dimyristoylphosphatidylcholine multibilayers. Biochim. Biophys. Acta. 946:417–423. [DOI] [PubMed] [Google Scholar]
- Tien, H. Ti. 1974. Bilayer Lipid Membranes (BLM). Marcel Dekker, New York.
- Tien, H. Ti, and A. Ottova-Leitmannova. 2000. Membrane Biophysics: As Viewed from Experimental Bilayer Lipid Membranes (Planar Lipid Bilayers and Spherical Liposomes). Elsevier, Amsterdam.
- Tristram-Nagle, S., H. I. Petrach, and J. F. Nagle. 1998. Structure and interaction of fully hydrated dioleoylphosphatidylcholine bilayers. Biophys. J. 75:917–925. [DOI] [PMC free article] [PubMed] [Google Scholar]
- Tristram-Nagle, S., R. Zhang, R. M. Suter, C. R. Worthington, W. J. Sun, and J. F. Nagle. 1993. Measurements of chain tilt angle in fully hydrated bilayers of gel phase lecitins. Biophys. J. 64:1097–1109. [DOI] [PMC free article] [PubMed] [Google Scholar]
- Tsong, T. Y., and R. D. Astumian. 1988. Electroconformational coupling: how membrane-bound ATPase transduces energy from dynamic electric field. Annu. Rev. Physiol. 50:273–290. [DOI] [PubMed] [Google Scholar]
- Umemura, J., T. Kamata, T. Kawai, and T. Takenaka. 1990. Quantitative evaluation of molecular orientation in thin Langmuir-Blodgett films by FT-IR transmission and reflection-absorption spectroscopy. J. Phys. Chem. 94:62–67. [Google Scholar]
- Williams, L. M., S. D. Evans, T. M. Flynn, A. Marsh, P. M. Knowles, R. J. Bushby, and N. Boden. 1997. Kinetics of the unrolling of small unilamellar phospholipid vesicles onto self-assembled monolayers. Langmuir. 13:751–759. [Google Scholar]
- Wong, P. T. T., and H. H. Mantsch. 1988. High pressure infrared spectroscopic evidence of water binding sites in 1,2-diacyl phospholipids. Chem. Phys. Lipids. 46:213–224. [Google Scholar]
- Zakharov, S. D., T. I. Rokitskaya, V. L. Shapovalov, Y. N. Antonenko, and W. A. Cramer. 2002. Tuning the membrane surface potential for efficient toxin import. Proc. Natl. Acad. Sci. USA. 13:8654–8659. [DOI] [PMC free article] [PubMed] [Google Scholar]
- Zamlynny, V., I. Zawisza, and J. Lipkowski. 2003. PM-FTIRRAS studies of potential-controlled transformations of a monolayer and a bilayer of 4-pentadecylpyridine, a model surfactant on a Au(111) electrode surface. Langmuir. 19:132–145. [Google Scholar]
Associated Data
This section collects any data citations, data availability statements, or supplementary materials included in this article.


