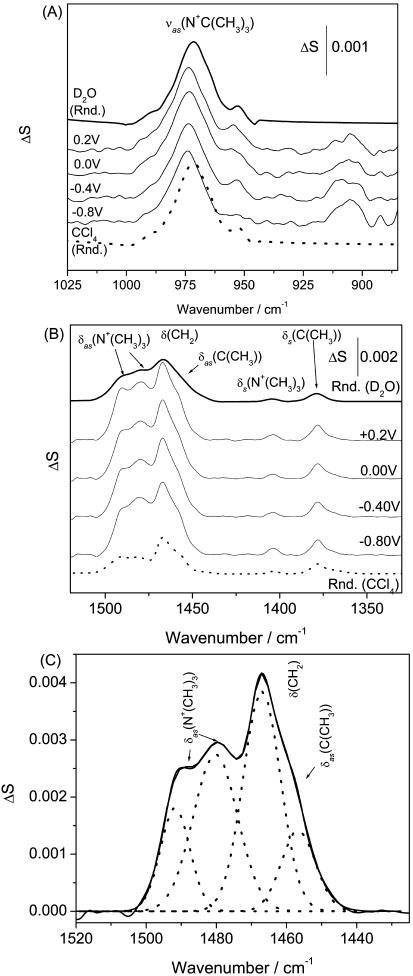
FIGURE 10.
PM-FTIRRA spectra in the (A) CN stretching  region and (B) CH bending modes region of a DOPC bilayer on an Au(111) electrode in 0.1 M NaF/D2O solution at different potentials marked on the figure. Thick lines—calculated spectra (solid lines) from D2O DOPC vesicles dispersion and (dashed lines) CCl4 solution for 4.5 nm thick film. (C) Example of a deconvoluted spectrum of the overlapping δas(N+(CH3)3), δ(CH2), and δas(C(CH3)) modes at E = −0.5 V.

