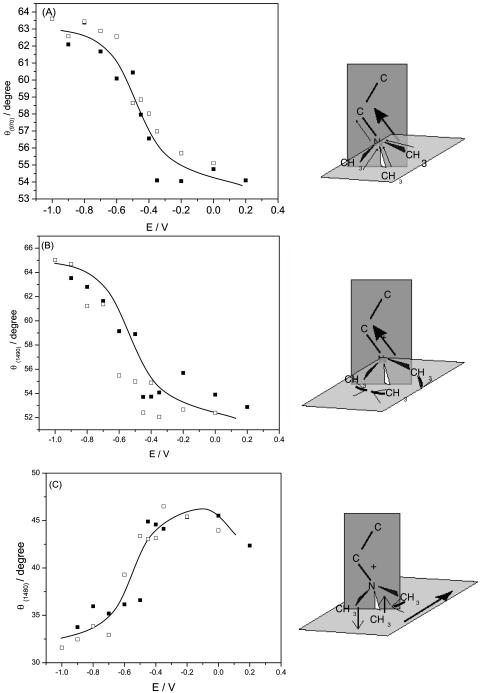
FIGURE 11.
(A) Dependence of the angle (θ) between the transition dipole moment and the electric field vector for the  on the electrode potential in the DOPC bilayer on Au(111) in 0.1 M NaF/D2O; (B) δas(N+(CH3)3) peak at 1490 cm−1 and (C) peak 1480 cm−1, (filled squares) positive, (open squares) negative potential steps.

