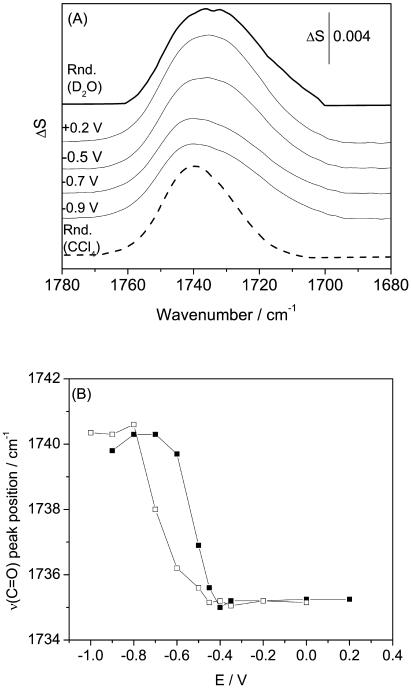
FIGURE 4.
(A) PM-FTIRRA spectra in the ν(C=O) stretching region of a DOPC bilayer on an Au(111) electrode in 0.1 M NaF/D2O solution at potentials indicated on the figure. Thick lines spectra calculated for 4.5 nm thick DOPC bilayer in different environments: (solid lines) D2O; (dashed line) CCl4 solution. (B) Dependence of the position of the maximum absorption frequency of ν(C=O) stretch on electrode potential in a DOPC on an Au(111) surface; (filled squares) positive and (open squares) negative potential step.

