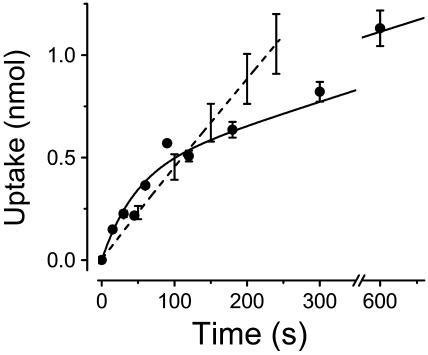
FIGURE 3.
Determination of 2-deoxyglucose (2DG) uptake by GLUT2-expressing oocytes. The solid circles represent the uptake of radio-labeled 2DG into GLUT2-expressing oocytes averaged over up to five different batches of oocytes. Error bars are shown for time points where the uptake represents at least four individual experiments. The smooth curve accompanying the 2DG uptake data is fitted to the data (see Appendix A). For comparison, the dashed line represents αMG transport into SGLT1-injected oocytes (n = 5) as obtained from the cotransport current integration divided by 2.

