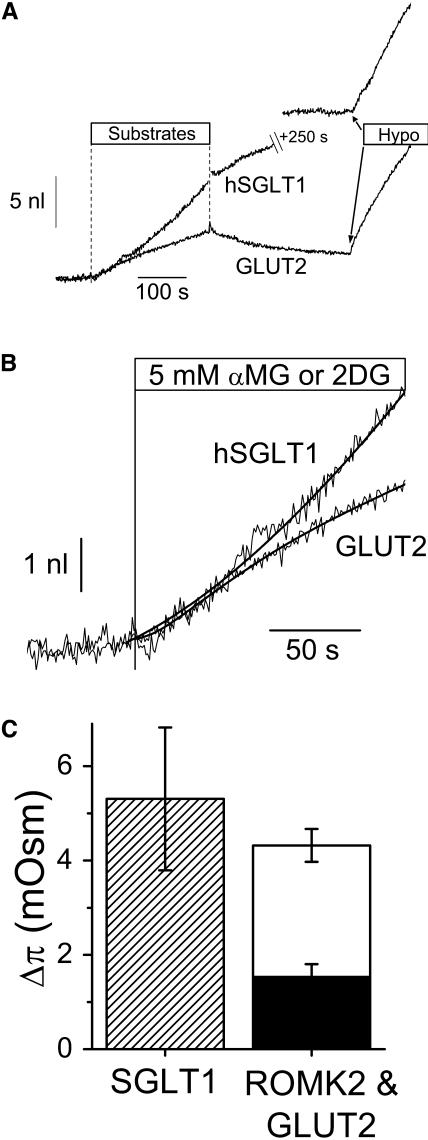
FIGURE 4.
Comparative volumetric analysis between SGLT1- and GLUT2-expressing oocytes. (A) Transport was stimulated for 250 s by the addition of 5 mM αMG or 5 mM 2DG for SGLT1- and GLUT2-expressing oocytes, respectively. An hypotonic shock of −20 mOsm/kg is imposed at the end of each experiment to determine the Lp value. (B) Enlargements of the volume changes presented in A. The water flows after 30 s of transport were determined from the slopes of the empirical fits (smooth lines shown in B) . For these specific experiments, the water permeabilities were 6.13 × 10⁻⁴ cm/s for the SGLT1-, and 6.97 × 10⁻⁴ cm/s for the GLUT2-expressing oocyte; and the osmotic pressures deduced from their swelling at t = 30 s and normalized for the equivalent of a 1 μA cotransport current are 6.8 mOsm and 3.4 mOsm, respectively. (C) Osmotic pressures determined from the ratios between swelling at 30 s and initial slope of the hypotonic shock (n = 5, 5, and 9, for SGLT1, ROMK2, and GLUT2, respectively). The osmotic pressures were normalized for an equivalent 1 μA cotransport current at t = 30 s (which, for GLUT2, corresponds to 2× the 2DG uptake multiplied by the Faraday constant of 96,490 Coul × mol−1). The mean ROMK2 value (solid bar) accounts for 29 ± 10% of the SGLT1 value and the mean GLUT2 value (unfilled bar) accounts for 52 ± 16% of the SGLT1 value.

