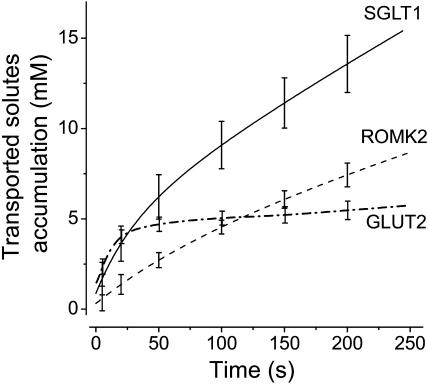
FIGURE 5.
Corrected solute accumulation as a function of time for SGLT1 (full line, n = 5), ROMK2 (dashed line, n = 5), and GLUT2 (dash-dotted line, n = 9). The corrections, when added to the osmotic gradients obtained from swelling rates, compensate for the global dilution due to water entry and are applied to each individual experiment before averaging.

