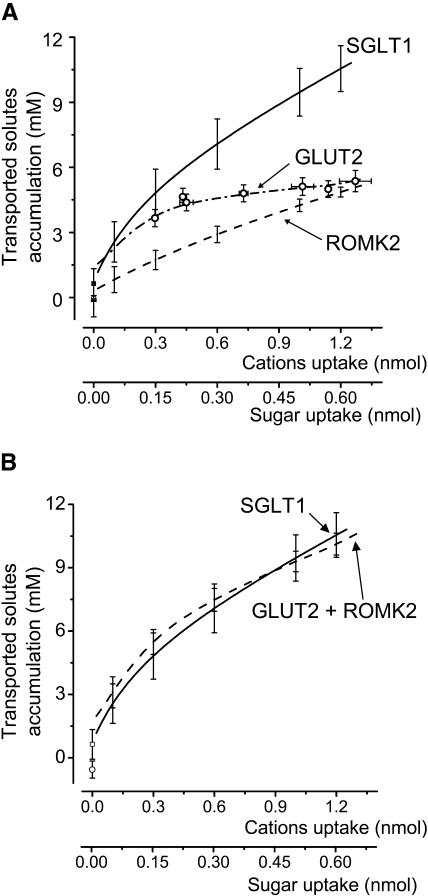
FIGURE 6.
(A) Effective transported osmolyte concentrations as a function of the quantity of substrate transported for SGLT1 (n = 5, full line), ROMK2 (n = 5, dashed line), and GLUT2 (n = 9, dotted line and open circles). The values at zero uptake are obtained with linear regressions over the minute preceding the onset of transport. (B) Addition of the substrate accumulations from GLUT2 and ROMK2 (dashed line, open circle) reproduces the substrate accumulation calculated from SGLT1 experiments (continuous line, open square).

