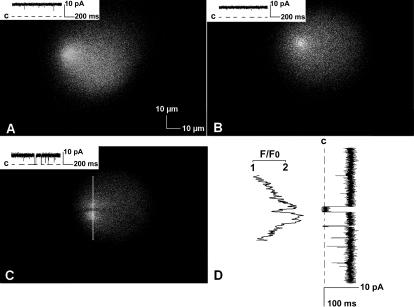
FIGURE 5.
Bilayer “Ca2+ sparks.” Three examples of fluo-3 fluorescence recorded in response to Ca2+ flux through single RyR2 channels reconstituted in bilayers are shown in panels A–C. These images contain 768 × 512 pixels (0.12 μm/pixel) and required 1 s to acquire (the scanning pattern was left to right, then top to bottom). Simultaneous recordings of single RyR2 channel currents are shown in the inset in each panel, where “C” indicates the level of zero net current. The dark horizontal zone through the bright center of the fluorescence signal in panel C resulted from a brief closing of the channel while the position of the channel was being scanned. An intensity versus time trace obtained from top to bottom through the center of the fluorescence (white vertical line in panel C) is aligned with the current trace in panel D. The conditions used in these experiments resulted in current amplitudes of 8–10 pA. The illuminated areas approximate the dimensions of the hole containing the bilayers. Background fluorescence is due to buildup of Ca2+ in the cis chamber with repeated voltage steps.

