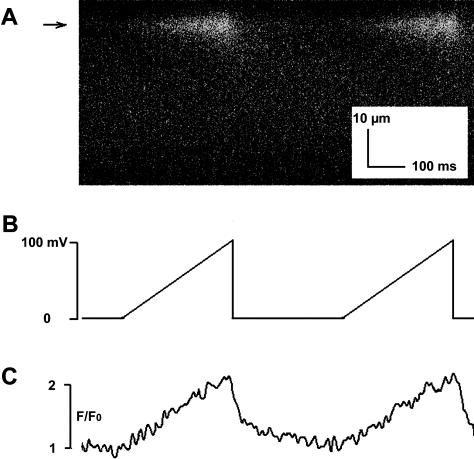
FIGURE 8.
The VC protocol can be used to produce Ca2+ fluxes having arbitrarily complex waveforms. A x-t line scan image of fluo-3 fluorescence in response to Ca2+ fluxes through a single RyR2 channel (panel A) were elicited in the bilayer system using voltage ramps (panel B). Fluorescence intensity-time traces obtained at the location indicated by the arrow in panel A are shown in panel C. As in Table 1, values were obtained by averaging data from five lines centered on the spark. These data illustrate the capability of the VC protocol to mimic different rates of activation and inactivation of clusters of multiple RyR2 channels. In addition, the temporal similarity between the voltage command signal and the imaged fluorescence demonstrate the temporal properties of the optical bilayer system.

