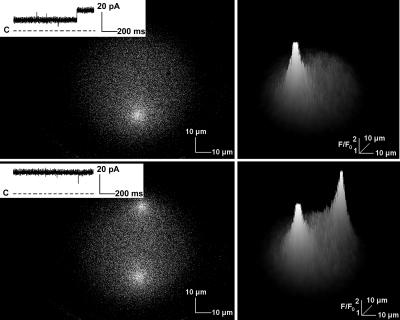
FIGURE 9.
Ca2+ flux through multiple RyR2 channels imaged in the bilayer system. A single RyR2 channel was active during most of the 1-s x,y scan shown in the top left panel. A second RyR2 channel activated toward the end of the scan, but only a single fluorescent signal was observed since this channel was in a region of the bilayer that had already been imaged. Both RyR2 channels were active during the entirety of a subsequent scan (bottom left panel) and two discrete fluorescent signals were recorded. RyR2 Ca2+ currents recorded during the scans are shown in the insets of these panels. Three-dimensional representations of the associated intensity changes are shown in the panels on the right side of the figure. The flattened tops of the signals result from the square shape of the Ca2+ flux and not from signal saturation.

