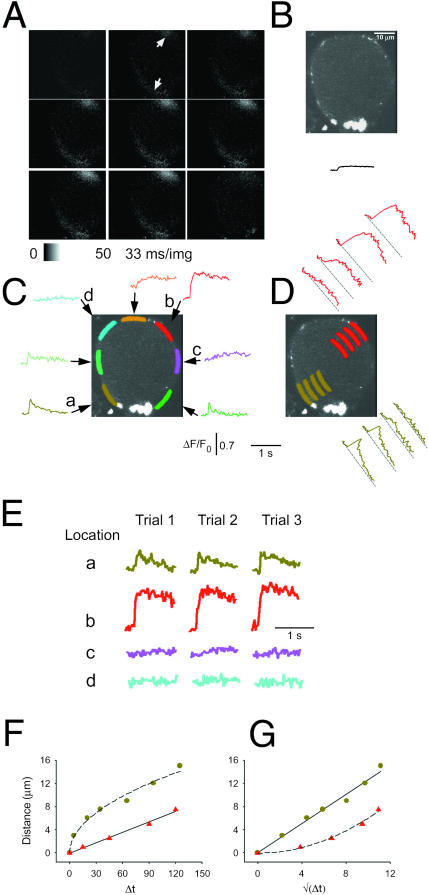
FIGURE 2.
Nonuniform calcium responses of a frog neuron in intact sympathetic ganglion during individual action potentials. Confocal images were collected at video rate (33 ms/image) from a fluo-4 AM loaded frog neuron, located inside of a partially digested sympathetic ganglion, during APs induced by field stimulation (see Methods). The APs were repeated 3×, with a 2-min break between each stimulus, and the corresponding images in each of the three series of images (53 images per series) were signal-averaged offline to create an averaged sequence. (A) The first eight images are sequential elements of the averaged sequence, whereas the last panel corresponds to the 53rd image recorded after the 2-min break between AP applications. The field stimulus was applied 1 ms into the second image of Fig. 2 A, corresponding to 1/30th of the vertical dimension of this image (see Methods). The fluorescence signal corresponds to ΔF (= F–F0; see Methods) and is presented on a stretched lookup table (see panel below). The two white arrows indicate the two hot spots for Ca2+ release. The arrow at the direction of 7 o'clock points at the hot spot in the peripheral perinuclear area, whereas the arrow at 1 o'clock shows the nonnuclear hot spot, which is located near the axon hillock. (B) A confocal image of fluo-4 fluorescence of the same neuron, collected at the same focal plane as in A using online frame averaging of 16 frames of raw images, collected at video rate without stimulation, to improve image quality. The nucleus was always located at the periphery, a few microns inside the PM, both in neurons in intact ganglia and in cultured cells. The bright area near 6 o'clock in B may be a presynaptic bouton of an axosomatic synapse. Similar bright fluorescent structures were found on the majority of intact ganglion neurons of this study. The solid line under the cell's image shows the ΔF/F0 response averaged over the entire cell, using the same time- and fluorescence scales as in C and D. (C) Spatially averaged values of fluorescence were calculated from the indicated color-highlighted areas of interest (AOIs) around the perimeter of the cell, using successive frames of the averaged sequences of images. The corresponding color-coded records give ΔF/F0 values, where F0 was calculated as the mean of the fluorescence value in the AOI in the first five images in the average sequence, all recorded before the field stimulus. The AOIs that were plotted in shades of green (light, dark, and olive) are at or near the peripheral perinuclear zone, whereas the red AOI is at the axon hillock. The location of the axon was observed directly by using transmitted light microscopy before the AP experiments, but the axon was outside the confocal plane of focus after switching to fluorescence imaging. The orange and pink AOIs were close to the axon hillock. All of the colored AOIs were drawn inside the cell at a constant distance from the PM, and all were of the same width and length (33 μm2). The nonuniform distribution of calcium signals around the periphery of the cell was detected in seven out of seven intact ganglion cells. Special care was taken when positioning the perinuclear AOI (olive-green), while analyzing this and all other experiments, to avoid any overlap between this AOI and the intranuclear space. (D) Radial spread of the fluo-4 signal from two hot spots in the same neuron. The olive-green (perinuclear) and red (axonal) AOIs were shifted to increasing radial distances from the periphery of the cell, to calculate the time course of ΔF/F0 at deeper zones of the cytosol (red) or nucleus (olive-green). The position of each record within the two stacks of AOIs (red curves above the cell's image, olive-green curves below and to the right of the image) corresponds to the position of the respective AOI inside the cell relative to the PM. (E) Time course of unaveraged fluorescence during each of the individual three APs on a compressed timescale. The areas selected for presentation were from the peripheral perinuclear zone (a, olive-green), the axon hillock area (b, red), and two of the quiescent peripheral nonnuclear regions (c, pink, and d, cyan). The field stimuli were 2-ms long in all cases. (F) Radial distance of the AOI from the PM as a function of the time to half-maximum rise of ΔF/F0 at that AOI. To calculate these data, seven or five AOIs were selected in the nuclear and nonnuclear areas, respectively, arranged radially at gradually larger distances from the PM (similarly to the arrangement of AOIs in D). The distance between the AOIs and the PM was measured in μm using our custom-made IDL program, whereas the time to half-peak at each AOI was calculated in milliseconds as the time interval between the arrival of the electric field stimulus and the half-maximum time of the resulting Ca2+ transient at that AOI. (G) Same data as F but plotted as a function of the square root of the time to half-peak. In both F and G, the rise-time values were corrected for the time to half-peak at the most peripherally located AOI, which was estimated for each data set by the x-intercepts of the straight lines fit to the data for spread from nonnuclear (F, red triangle) or nuclear (G, olive circles) hot spots.

