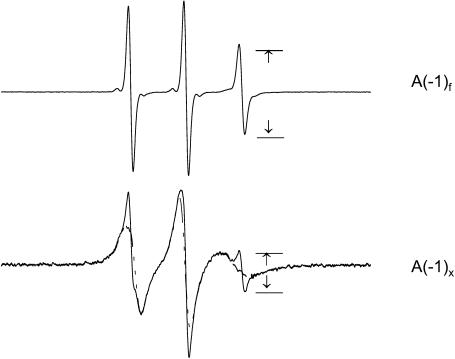
FIGURE 1.
EPR spectra of MTSL-labeled CM15-C12 (top) in aqueous solution and (bottom) in the presence of POPE/POPG (80:20) LUVs with ∼90% bound. At bottom, the spectrum of fully-bound peptide (dashed line) is superimposed. The peak-peak amplitudes A(−1)f and A(−1)x are used to calculate the fraction of peptide bound (Eq. 3).

