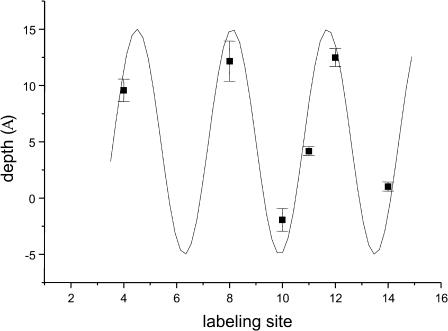
FIGURE 4.
Immersion depth as a function of labeling position. Depths relative to the membrane-aqueous interface were calculated from the depth parameter, Φ (Eq. 2), and comparison to a series of n-doxylphosphatidylcholine spin-labels. Error bars are based on the maximum propagation of the uncertainties in Π values. Positive values indicate sites embedded in the hydrophobic phase and negative values exposure to the aqueous phase. The solid line is a sine curve with a periodicity of 3.6.

