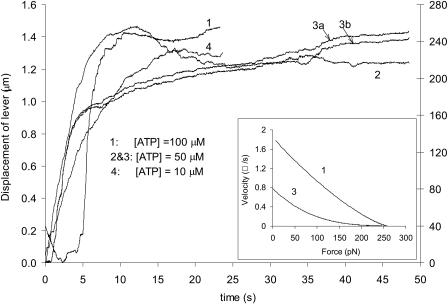
FIGURE 2.
Time courses of lever displacement at different [ATP]. Inset: Force-velocity curves corresponding to displacement traces. To obtain the force-velocity curves, exponential functions were used to fit the displacement curves, which were then linearly regressed at time segments of five data points with an increment of one data point. For clarity, only two traces are shown, and the dip toward the end of trace 1 was not included.

