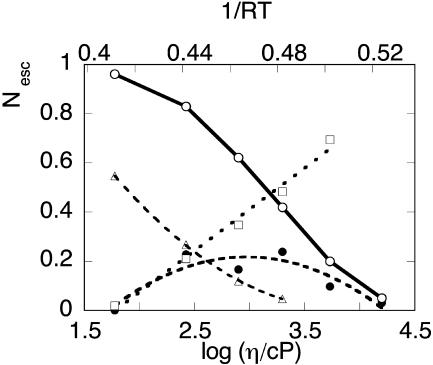
FIGURE 11.
Ligand escape yields from myoglobin as a function of viscosity (lower axis) or temperature (upper axis). ○, CO total escape yield; •,  the absolute yield of CO escape via the Xe1 cavity. Δ, O2 total escape yield. □, fraction
  of CO escaped via Xe1. Lines are drawn to guide the eye. The solvent was Gly 79% w/w.

