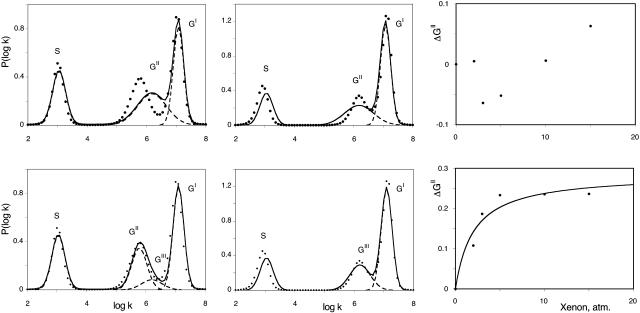
FIGURE 7.
Examples of the global fits of the rate spectra for oxygen rebinding with SW MbO2 at 273 K in the absence of xenon (left) and in the presence of 15 atm of xenon (middle). The points correspond to the P(log k) distributions calculated by MEM from the kinetics, and the lines to the fits. These fits correspond to a sum of three (top) or four (bottom) Gaussians assuming constant band positions and variable amplitudes for the different components. (Right) Corresponding titration curves of the decrease of the area of band GII. Only the four Gaussian hypothesis leads to satisfactory fits of the rate spectra and to a good hyperbolic fit (line) of the titration curve.

