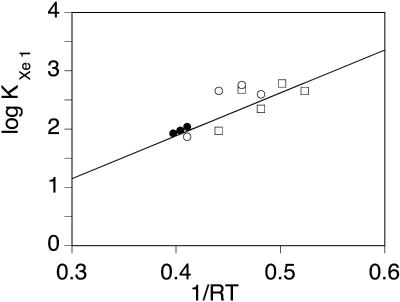
FIGURE 8.
Arrhenius plot of the equilibrium constant for xenon binding to the Xe1 proximal cavity of SW Mb, determined by titrating the changes in the area of process GII upon xenon addition (Oxygen: ○; CO: □). The values determined in Ewing and Maestas (1970) by absorption measurements are shown as closed circles, but were not included in the least-square linear regression.

