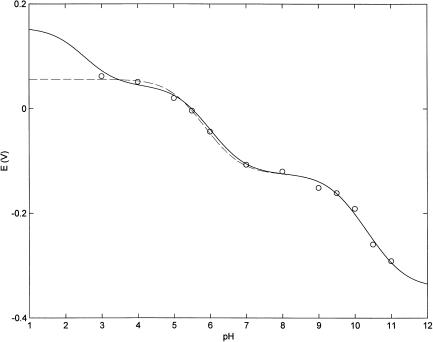
FIGURE 1.
pH-dependence of redox potentials of bovine lactoperoxidase at 25°C. Dashed line corresponds to the nonlinear least-squares fitting of data according to Eq. 1 with n = 2. Continuous line corresponds to the nonlinear least-squares fitting of data according to Eq. 1 with n = 3 by global analysis. For further details, see text.

