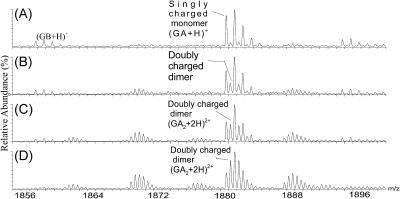
FIGURE 2.
Partial mass spectra taken with a Q-Tof II by electrospray from various solvents and showing the m/z region for singly charged monomers and doubly charged dimers. The experimental details are described in the methods section. The amount of dimer depends on the dielectric constant of the solvent and increases in the order: TFE (A) < methanol (B) < ethanol (C) < n-propanol (D).

