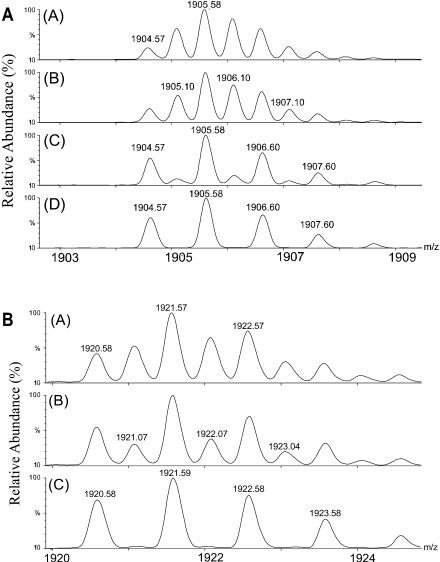
FIGURE 4.
(A) Magnified view of the mass spectrum for the region of (GA2 + 2 Na)2+ as a function of collision energy. Spectrum A was obtained at a collision voltage of 10 V, B at 20 V, C at 30 V, and D at 40 V. (B) Magnified view of the mass spectrum in the region of (GA2 + 2 K)2+ as a function of collision energy. Collision voltages were (A) at 10 V, (B) at 20 V, and (C) at 30 V applied to collision cell. The data in panels A and B were acquired on a Q-Tof Ultima GLOBAL, as described in the Methods and Materials section.

