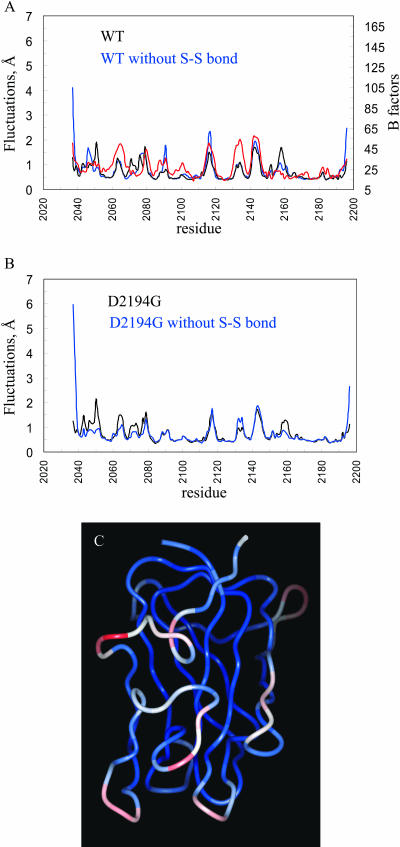
FIGURE 2.
Root mean square fluctuations computed over the last 900 ps of the MD simulations. (A) RMSF of the simulated WT structures with (black) and without (blue) S-S bond and the B-factors (Cα atoms) of the C2 x-ray structure (red). (B) RMSF of the simulated mutant D2194G structures with (black) and without (blue) S-S bond, (C) Ribbon diagram for the averaged modeled structure of the D2194G mutant over the last 900 ps of the MD simulations color coded according to the calculated RMSF.

