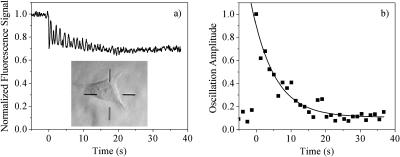
FIGURE 2.
(a) Experimental data obtained from a 2P-c-FRAPP experiment on a live XTC-2 cell. A transmitted light image of the cell is shown in the inset, and the excitation occurs at the center of the cross-hairs. (b) Decay of the oscillation amplitude for the data in a, where each point represents the oscillation amplitude during a half cycle of the piezo phase shifter, along with an exponential fit to the data points.

