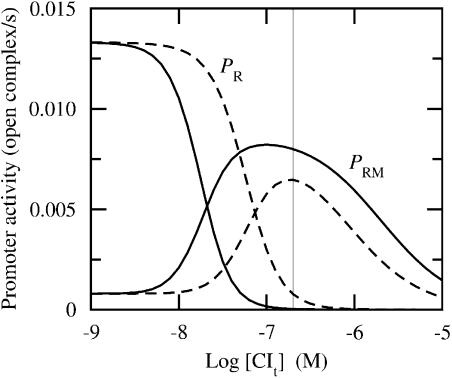
FIGURE 2.
Promoter activity versus total CI concentration for two different data sets ([Cro] ≈ 0 in both sets). Fully drawn curves correspond to CI affinity data from Koblan and Ackers (1992) (applied throughout this work) and dashed lines correspond to CI affinity data from Shea and Ackers (1985). Cro affinity data are from Shea and Ackers (1985) in all simulations (applied throughout this work). PR corresponds to cro activity and PRM corresponds to cI activity. Thin vertical line indicates lysogenic concentration (≈200 nM). Unit “open complex/s” corresponds to the number of RNAP-DNA complexes that are being transformed from the closed to open form (isomerizations) per second. Abscissa is drawn on logarithmic (decadic) scale.

