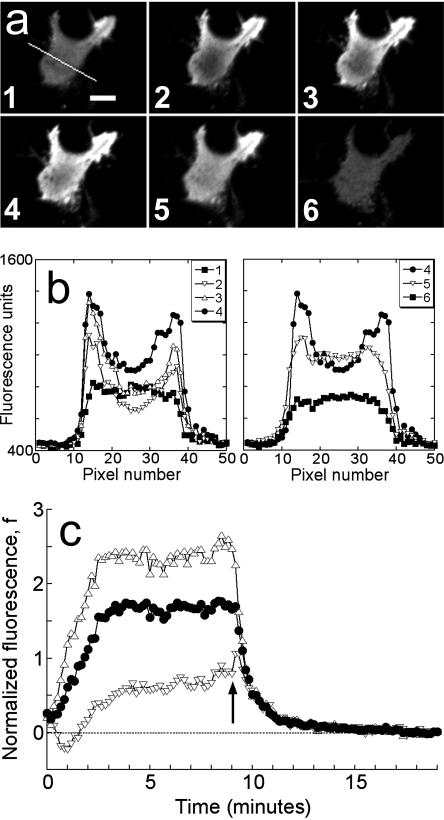
FIGURE 1.
Association-dissociation experiments with TIRF excitation. (a) Total internal reflection fluorescence (TIRF) images of a representative GFP-AktPH-transfected NIH 3T3 fibroblast. Panel 1 shows the cell before treatment (scale bar = 10 μm); the line scan used to generate the data is also shown. Panels 2, 3, and 4 were acquired 1, 2, and 7 min after addition of 10 nM PDGF-BB, over which time the fluorescence profile achieved a steady state. Panels 5 and 6 were acquired 0.5 and 10 min after addition of wortmannin, which rapidly blocks 3′ PI production. (b) Raw fluorescence profiles across the line scan are shown for each of the six images in a. (c) The line scan profiles at all time points, acquired every 10 s, were converted into normalized kinetic traces as described in Materials and Methods: open triangles, contact area periphery f(1,t); open inverted triangles, contact area center f(0,t); closed circles, contact area average  . Time zero corresponds to the addition of PDGF, and the arrow signifies the addition of wortmannin.

