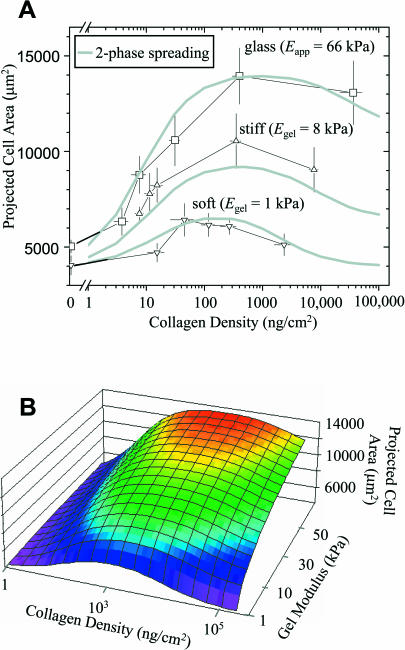
FIGURE 5.
Spread cell area as a function of ligand density on soft, stiff, and rigid substrates. (A) The projected cell area was determined 4 h after plating (n > 10 per datapoint), giving the indicated average (mean ± SE). The smooth curves are calculated from a model for two-phase spreading (see Appendix) expressed in terms of both E (or Eapp) and collagen density. Note that cells respond strongly to increasing collagen density on glass and hardly at all on soft gels. (B) Curved surface in three dimensions that fits SMC spreading.

