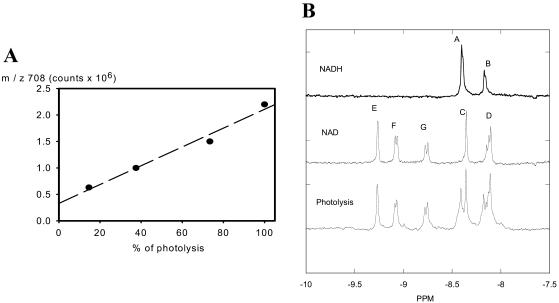
FIGURE 1.
Mass spectroscopy and NMR data on NADH photolysis. (A) Mass spectroscopy data. The relationship between the degree of NADH photolysis and the abundance of m/z 708 (disodium salt of NAD). Degree of photolysis was determined by 100 × (1−(NADHphotolysis/NADHc)) where NADHc is control fluorescence and NADHphotolysis is fluorescence after photolysis. (B) 300 MHz proton spectrums of NAD, NADH, and photolysis products of NADH. All samples were initially 0.4 mM in 100 mM phosphate buffer pH 7.0. Each spectrum is the average of 600 transients collected in 2-s intervals. Resonance assignments: NADH is A, C8 of adenosine, and B, C2 of adenosine. NAD is C, C8 of adenine, D, C2 of adenine, E, C2 of nicotinamide, F, C6 of nicotinamide, and G, C4 of nicotinamide. Assignments based on Sarma et al. (1968), Meyer et al. (1962), and Jardetzky and Wade-Jardetzky (1966).

