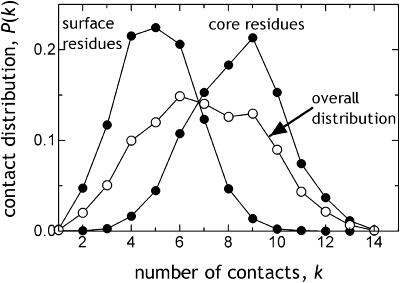
FIGURE 2.
Residue contact distribution at rc = 7 Å, computed as an average over all the residues in a set of 54 proteins. The familiar form of the contact distribution is captured (see, for example, Fig. 4 in Miyazawa and Jernigan, 1996). The contact distributions of core and surface residues are also displayed. Gaussian distribution of coordination numbers is valid for both the hydrophobic core and the molten surface.

