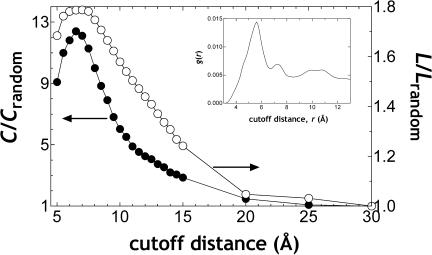
FIGURE 6.
In a SWN, characteristic path length, L, is on the same order of magnitude as its randomized counterpart, whereas clustering density, C, is at least one order of magnitude larger. The variation of the ratios L/Lrandom (right ordinate) and C/Crandom (left ordinate) in the residue networks with the cutoff distance, rc, used in forming the networks is shown. Note that asrc → ∞ both L and C approach 1, because every node will be connected to every other node at this limit. (Inset) Radial distribution function of the residue networks. All data are averages over 595 nonhomologous proteins.

