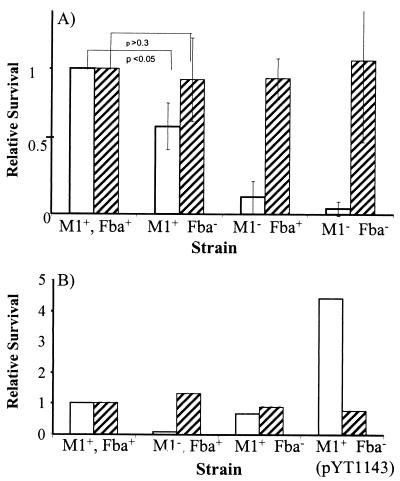
FIG. 5.
(A) Survival of GAS in human blood and plasma. GAS strains were grown to early- to mid-log phase, and 102 CFU of each strain were added to heparinized human blood (open bars) or human plasma (hatched bars). A portion of each culture was plated to determine the input CFU. Cultures were incubated at 37 C for 3 h. Portions of each culture were again plated to determine the number of surviving CFU. The growth index of each culture was calculated by dividing the number of surviving CFU by the number of input CFU. For each experiment, the growth index for strain 90-226 (M1+ Fba+) was assigned a value of 1. Growth indices for the mutant strains are expressed relative to strain 90-226. The data in the figure were obtained from four independent experiments. Error bars represent standard deviations. (B) Complementation of the fba mutation. Experiments were performed as described for panel A. The M1+ Fba− strain is DC283. M1+ Fba− (pYT1143) is DC283 carrying the Fba expression plasmid pYT1143 (48). Values are the averages from two experiments.

