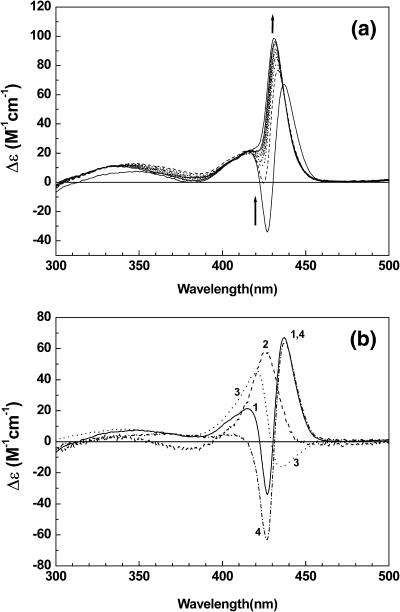
FIGURE 6.
(a) NaCl concentration dependent CD spectrum of the TMPyP-poly[d(A-T)2] complex. [poly[d(A-T)2]] = 200 μM in nucleobase, [TMPyP] = 10 μM. For the arrow direction, the concentration of NaCl is 0, 1, 4, 14, 30, 50, 80, 100, and 200 mM. (b) CD spectrum of the TMPyP-poly[d(A-T)2] complex in the presence of 0 mM NaCl (curve 1), TMPyP-duplex 2 complex at R = 0.4 (curve 2) and 2.2 (curve 3). Curve 4 = curve 1 − (0.42 × curve 2) + (0.30 × curve 3). See text.

