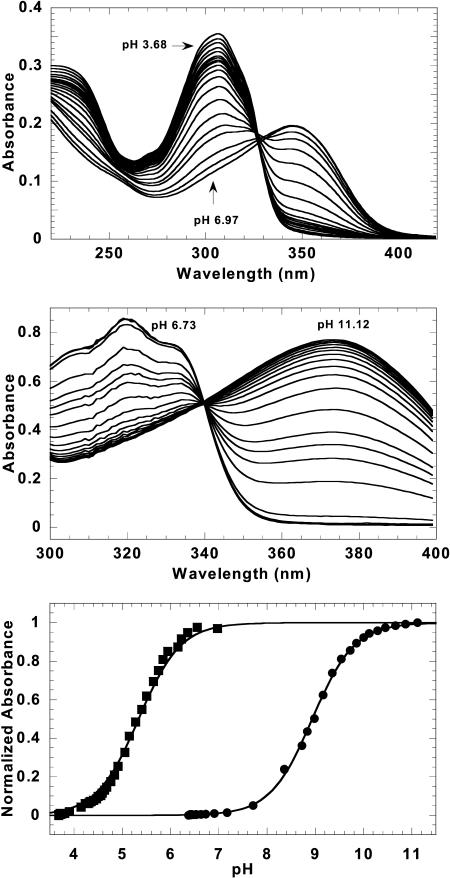
FIGURE 2.
Titration spectra of CGP 40215A free and bound to poly(dAT)2. Spectral shifts of CGP 40215A in water are shown under different pH conditions (top). Under acidic conditions, the absorbance at 350 nm is low and it increases as the pH increases. Similar effects were observed for bound ligand (middle). Fits of the normalized absorbance data (at 347 nm for free and 373 nm for bound ligand) yield pKa values 5.4 and 8.9, respectively (bottom).

