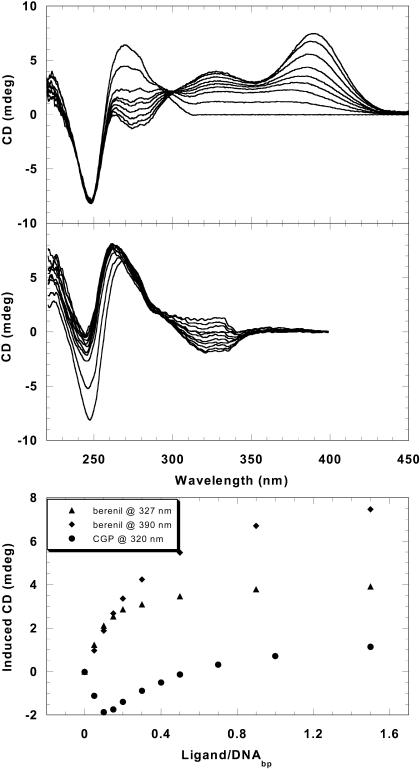
FIGURE 3.
CD titration spectra of the AT hairpin with berenil or CGP 40215A. Strong positive-induced CD is observed above 300 nm with berenil (top), but weak negative CD (at low ligand/DNA) is observed for CGP 40215A (middle). The induced CD signals at 327 nm and 390 nm for berenil and at 320 nm for CGP 40215A are plotted against the ligand/DNA(basepairs) ratios (bottom). The break at ∼0.2 corresponds to two berenil molecules per one AT hairpin whereas the most induced negative CD signals are observed at a ratio (r = 0.1) equivalent to one CGP molecule per one AT hairpin.

