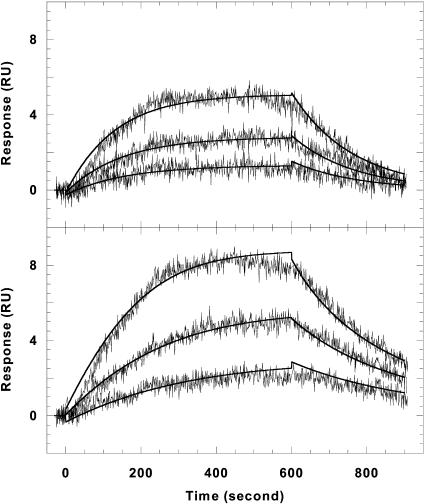
FIGURE 6.
Kinetic fitting plots of CGP 40215A with the AATT hairpin (top) and the AT hairpin (bottom). Sensorgrams for the three lowest concentrations along with the global fitting curves (solid lines) are shown. The rate constants are summarized in Table 1.

