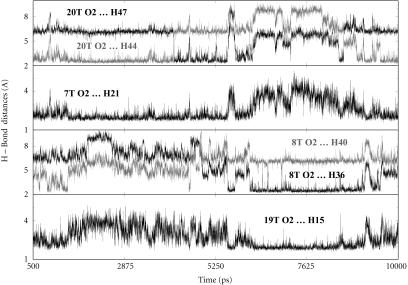
FIGURE 7.
H-bond distances between some CGP 40215A groups and DNA bases as predicted from MD simulations at 300 K. The top panel illustrates the H-bond interaction between the O2 of T20 and hydrogens from one of the amidine groups. The rapid interchange at ∼4 ns indicates a rapid rotation of the amidine group. The second panel illustrates the H-bond interaction between the O2 of T7 and H21 on the linker. The third and fourth panels illustrate the simultaneous moments occurring at the other end of the binding site with the other amidine interacting with O2 of T8 as well as H15 on the linker with O2 of T19. At ∼5.3 ns, the ligand moves from one end of the binding site to the other as evident from the increase in H-bond distances of the departing amidine (top panel) and the decrease in H-bond distances of the approaching amidine (third panel).

