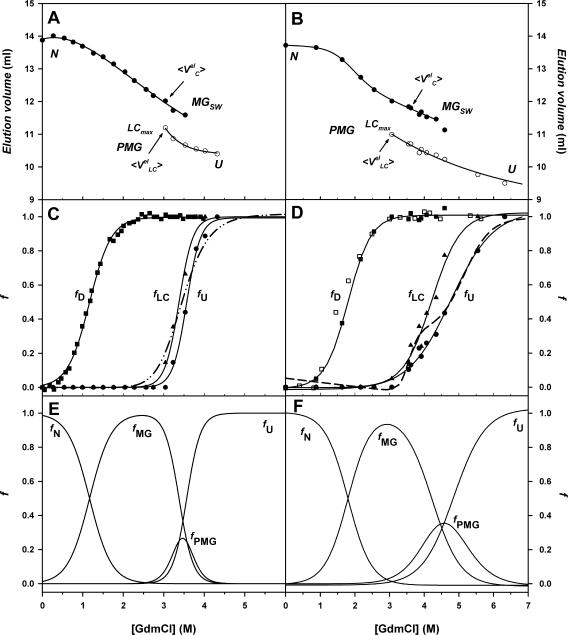
FIGURE 9.
GdmCl-induced unfolding transitions of Tslig monitored by size-exclusion chromatography. Dependence of elution volumes Vel of deadenylated (A) and adenylated (B) Tslig on GdmCl concentrations. 〈VC〉, elution volumes of “compact” molecules and  elution volumes of “compact” molecules and 〈VLC〉, elution volumes of “less compact” molecules
  elution volumes of “less compact” molecules. LCmax, maximal value of Vel for less compact molecules. N, native state; MGSW, swollen molten globule state; PMG, premolten globule state; U, unfolded state. Stages of unfolding (four-state transition) of deadenylated (C) and adenylated (D) Tslig. (C) Fraction of denatured molecules fD was obtained from the relative change of elution volumes from 0 to 3.53 M GdmCl (N↔MG transition) (▪); fLC, fraction of less compact molecules (▴); fU, fraction of unfolded molecules (•); fluorescence average emission wavelength, (dash-dotted line). (D) Fraction of denatured molecules fD obtained from the relative change of near UV ellipticity [θ]280 (□) and the relative change of elution volumes from 0 to 4.34 M GdmCl (N↔MG transition) (▪); fLC, (▴); fU, (•); relative change of far UV ellipticity [θ]222 (dashed line). Multiple-state GdmCl-induced N↔U transition in deadenylated (E) and adenylated (F) Tslig presented in terms of fractions of different states: fN, fraction of molecules in the native state; fMG, fraction in the molten-globule state; fPMG, fraction in the premolten globule state, and fU, fraction in the unfolded state.

