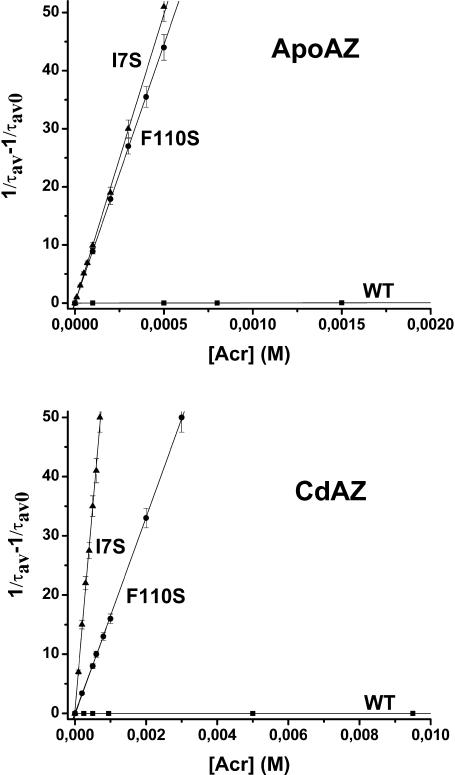
FIGURE 5.
Lifetime Stern-Volmer plots for the quenching of azurin phosphorescence by acrylamide. The proteins samples are: (▪) WT, (•) F110S, and (▴) I7S, in the apo-form (top panel) and Cd-form (bottom panel). The azurin concentration is 2–5 μM in Tris-HCl (2 mM, pH 7.5) at 20°C. Each point is the average of at least three independent experiments and the error bars indicate the range of τav variations.

